The Data Volume Dashboard Does Not Display Values For All Metrics
Symptom
The data volume dashboard only displays “N/A” for the volume of some or all metrics.
Possible Cause: Splunk Configuration
The data volume dashboard queries Splunk’s _internal index which in turn reads that data from Splunk’s log file license_usage.log. By default, every Splunk indexer periodically reports to the license manager stats of the data indexed: broken down by source, source type, host, and index. If the number of distinct (source, source type, host, index) tuples grows over the squash_threshold, Splunk squashes the {host, source} values and only reports a breakdown by {sourcetype, index}. This is to prevent high memory usage and an unwieldy number of license_usage.log lines.
Resolution
Increase the squash_threshold by adding the following to $SPLUNK_HOME/etc/system/local/server.conf:
[license]
squash_threshold = 10000
You will find more information here.
Possible Cause: Permissions
Your user account might not have permissions for the index _internal. To check first go to Settings -> Access controls -> Users -> Your user name and note the roles assigned to you. Then go to Settings -> Access controls -> Roles and check if any of your roles has either _internal or All internal indexes in the box Selected search indexes, i.e. one of these:
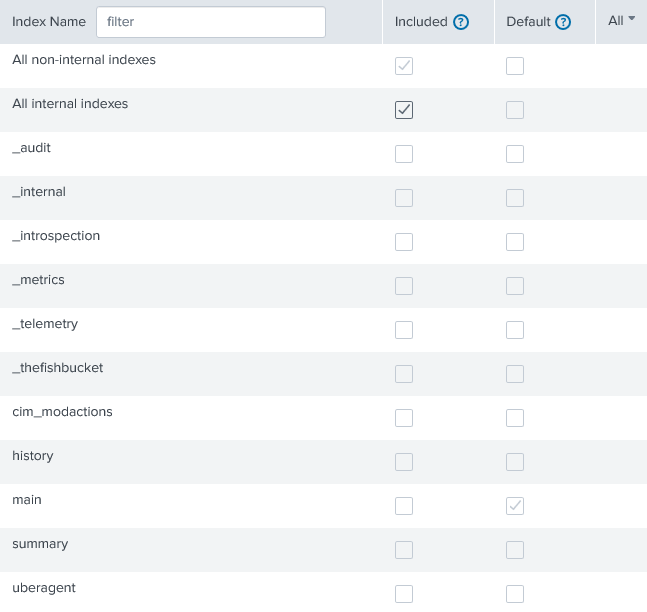
Resolution
Assign either _internal or All internal indexes to Selected search indexes of one of your roles.