Security Score
uberAgent ESA’s security score is a scoring system that calculates and visualizes the current and past status of ESA’s two primary data sources, Security and Compliance Inventory (SCI) and Threat Detection Engine (TDE). In short, SCI is a script-based test engine that detects insecure configurations, while TDE is a rules-based engine that continuously monitors endpoints for unusual or risky behavior. Security scores are assigned to the results of the two data sources and range from zero to ten. Scores of zero to four are considered high risk, scores of four to seven are considered medium risk, and scores of seven to ten are considered low risk.
Security Score Dashboard
The security score dashboard is the entry point to uberAgent ESA’s Splunk app. The dashboard visualizes security scores for the entire estate monitored by uberAgent ESA, breaking down data by data source, category, test, and rule tag to highlight potential security risks.
Overall Score
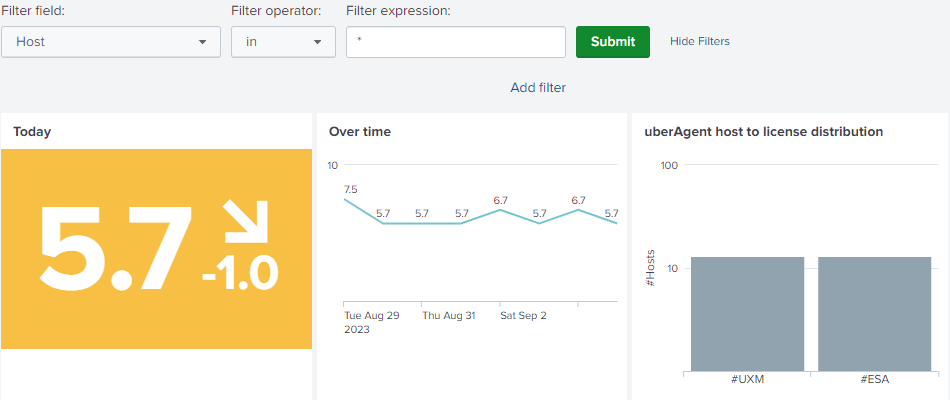
The filter at the top allows filtering the dashboard to a subset of machines. By default, all devices are shown.
On the left, one can see the overall score and the trend compared to yesterday. In the middle, the score development over time is visualized. On the right, one can see the host to license distribution panel, which compares and highlights uberAgent UXM to ESA deployment mismatches.
Security & Compliance Inventory and Threat Detection Engine Scores
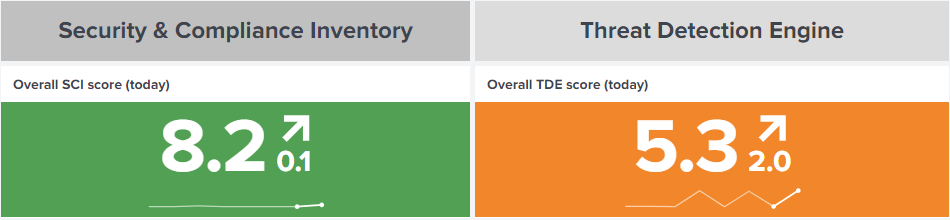
The overall score is derived from two data sources, SCI and TDE:
- SCI score: indicator for insecure or non-compliant configured devices, user accounts, and applications.
- TDE score: indicator for risky or unusual behavior of devices, user accounts, and applications.
The charts show a trend indicator for the last day and a sparkline for the last seven days.
Score Components
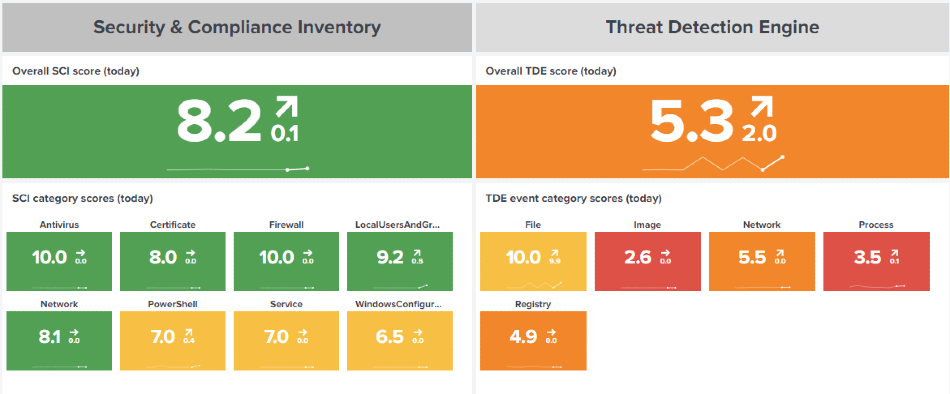
Each data source score is calculated from the underlying test category scores for the past seven days. See score calculation for further details. Each category score is displayed in a single-value visualization along with a sparkline and trend indicator.
uberAgent ESA ships with an extensive list of Security and Compliance Inventory tests to monitor various aspects of the endpoints. Each test belongs to a category. For each category, a security score is calculated and visualized in the dashboard panel. As customers may add their own tests, with their own categories, the dashboard dynamically displays test categories as test results are received by the (Splunk) backend.
Threat Detection Events can originate from various event types. Each event type is associated with a TDE event category, such as file, image, or network. The Security Score dashboard displays and calculates a security score for each TDE event category found in the events processed by the backend.
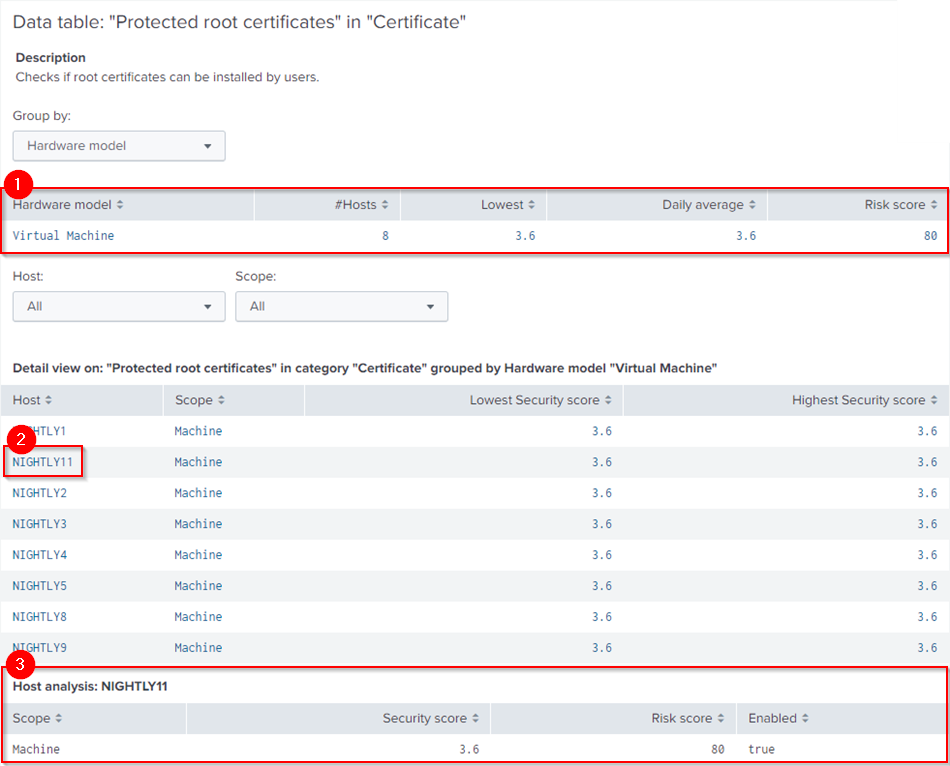
SCI Test Analysis
The charts below show scores for tests executed within the last 24 hours. Tests with low (red) or medium (yellow) security scores may warrant your attention.
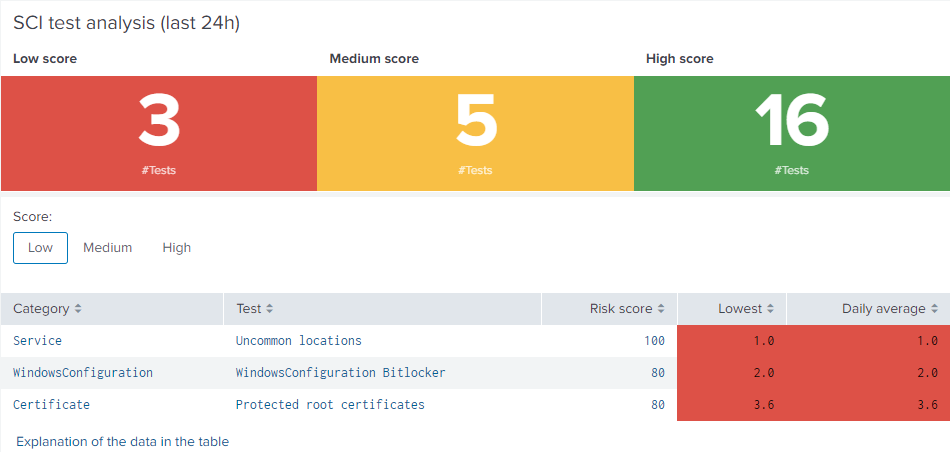
Click on an item in the table to perform a drilldown. If you do so, a new data table displays the results for a particular test. The table shows which endpoints the test was performed on. By default, hits are grouped by hardware model. Other groupings are available. To drilldown further, click the first column to display all hosts in the selected group by field (1). The new drilldown table displays the lowest and highest security score, as well as the scope of the test. To analyze a specific host, click the host (2). Another drilldown table displays the scope, security score, risk score, and the actual test result (3).
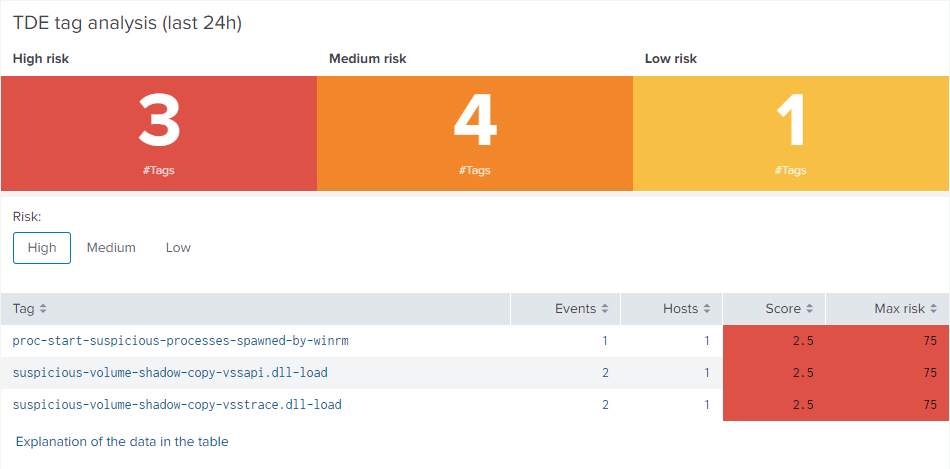
TDE Tag Analysis
The charts below show scores for TDE rule tags found within the last 24 hours. Low security scores are considered high risk (red), medium scores medium risk (orange) and high security scores low risk (yellow). Therefore, rule tags with low or medium risk scores may require the most attention. Click on an item in the table to analyze the tag in more detail on the Threat Detection Events dashboard.
Failed SCI Tests
![]()
Test executions can fail on endpoints for various reasons. If a test script runs into an error, uberAgent sends the errors message to the configured backend. The dashboard dynamically creates a button at the bottom of the page to display information about the failed execution. Click on the plus sign next to Failed SCI tests to reveal information about affected devices or users and error messages received in the last 24 hours.
Score Calculation
The security score is calculated separately for the two data sources as they contain different elements to be considered in the calculation.
SCI Score Calculation
Each test result is sent to the backend with a result score (SecurityInventoryScore) as well as a risk score (SecurityInventoryRiskScore). The result score is contains the actual test result, whereas the risk score describes the test’s importance (criticality). The following formula combines the result score with the risk score into the actual security score.
Each security score for SCI events is calculated as follows: (10 – ( 10 – SecurityInventoryScore) x SecurityInventoryRiskScore) / 100)
TDE Score Calculation
Events generated by the Threat Detection Engine do not come with a result score. Therefore, the following formula calculates a security score for TDE events.
Security score = ((101 – RiskScore)/10) x (1 – (#Events / #AllEvents) x 0.05 ) x (1 – (#Devices / #AllDevices) x 0.05)
The formula uses the following variables:
- RiskScore: The risk score that was configured for the specific TDE rule.
- #Events: The number of events for the specific TDE rule.
- #AllEvents: The number of all events produced by any TDE rule.
- #Devices: The number of devices affected by the specific TDE rule.
- #AllDevices: The number of all devices affected by any TDE rule.
The formula is designed to take into account three factors: risk score, number of events, and the number of devices. The first part of the formula subtracts the risk score from 101 and divides the result by 10. This is done to invert the risk score scale so that a higher risk score marks a lower security score. The second and third parts of the formula are based on the concept of exponential decay. They calculate the proportion of events and devices relative to their respective maximum values and then convert these proportions into a decay using the exponential function. The decay factors are then multiplied and scaled by a factor of 0.05. Multiplying with that factor ensures that the impact of counts (events and devices) on the security score is not too strong. Finally, the three factors are combined by multiplying them to result in the final security score for TDE events.
Score Ranges
Security Score
The security score combines uberAgent ESA’s main data sources, Security and Compliance Inventory and Threat Detection Engine. The score an indicator for insecurely configured devices, or risky behavior on endpoints. The table below shows the security score ranges, where their categorization changes and which colors are applied in the dashboard panels.
| Type | Threshold | SCI color | TDE color |
|---|---|---|---|
| High security score | >= 8 | green | yellow |
| Medium security score | >= 4 & <8 | yellow | orange |
| Low security score | < 4 | red | red |
Risk Score
The risk score is used to describe the importance of a SCI test or a TDE rule. As risk scores are used in the security score calculation, they are used to add weight to the actual result. Risk scores range from zero (low risk) to one hundred (high risk).
| Risk score | Threshold |
|---|---|
| High | >=80 |
| Medium | >= 40 & <80 |
| Low | < 40 |