Monitoring Windows Update Performance
Use the Splunk search below to list the duration of Windows Update activities that art part of the machine boot process. In addition to the Windows Update processing time, the search returns the disk IO incurred by the update process.
Why Measuring Windows Update Performance Is Crucial
A fundamental component of good endpoint management is Windows Update management. All devices must be kept up to date in order to provide as few opportunities as possible for malware to attack.
However, applying Windows updates also means stopping work for users, because typically the computer has to be restarted for this purpose. This is because Windows updates are installed during the computer startup.
Administrators are therefore keen to ensure that everything runs smoothly during the installation of updates in order to minimize the waiting time for users. So they need a way to monitor the performance of the update installation.
How uberAgent Can Help
uberAgent provides a deep insight into the computer startup performance of Windows endpoints in the dashboard Boot Duration. Every computer startup is divided into phases based on the Microsoft document Windows On/Off Transitions Solutions Guide. The installation of Windows updates is not a separate phase, but only a sub-phase.
Nevertheless, the installation of Windows Updates can be monitored with uberAgent, because uberAgent determines the runtime, command line and performance for each process that ran during boot.
Windows updates are installed by the Windows Update service. This is an instance of the svchost.exe process and can be identified by the following command line: svchost.exe -k netsvcs -p -s wuauserv.
The performance of processes at boot is best measured by the number of disk accesses (IOs). Many IOs means that the application or service has a negative impact on boot performance.
Splunk Search
The search below returns the following results for each Windows Update service startup:
- The computer name
- The unique ID generated by uberAgent to analyze the complete computer startup
- The start time of the computer startup
- The duration of the Windows Update phase
- The percentage of the total boot time that is taken up by the Windows Update phase
- The total duration of the computer startup
- The number of IOs of the Windows Update phase
- The percentage of the Windows Update phase in the total IOs of the computer startup
- The total number of IOs of the computer startup
| pivot `uA_DM_OnOffTransition_BootProcesses` OnOffTransition_BootProcesses
   latest(ProcLifetimeMs) as ProcLifetimeMs
   latest(TotalBootDurationMs) as TotalBootDurationMs
   sum(ProcIOReadCount) as SumProcIOReadCount
   sum(ProcIOWriteCount) as SumProcIOWriteCount
   splitrow BootUID
   splitrow host
   splitrow ProcCmdline
   filter ProcCmdline is "*svchost.exe -k netsvcs -p -s wuauserv"
| join type=left BootUID
[
   | pivot `uA_DM_OnOffTransition_BootProcesses` OnOffTransition_BootProcesses
      sum(ProcIOReadCount) as SumTotalBootProcIOReadCount
      sum(ProcIOWriteCount) as SumTotalBootProcIOWriteCount
      splitrow BootUID
   | fields + BootUID SumTotalBootProcIOReadCount SumTotalBootProcIOWriteCount
]
| join type=left BootUID
[
   | pivot `uA_DM_OnOffTransition_BootDetail` OnOffTransition_BootDetail
      latest(_time) as BootStartTime
      splitrow BootUID
   | eval "Boot start time"=strftime(strptime(BootStartTime, "%Y-%m-%dT%H:%M:%S.%Q%z"), "%Y-%m-%d %H:%M:%S")
   | fields + BootUID "Boot start time"
]
| eval "Applying Windows Updates duration (s)" = round(ProcLifetimeMs / 1000,1)
| eval "Total boot duration (s)" = round(TotalBootDurationMs / 1000,1)
| eval "Windows Updates duration of total (%)" = round(ProcLifetimeMs / TotalBootDurationMs * 100,1)

| eval "Applying Windows Updates IO count" = SumProcIOReadCount + SumProcIOWriteCount
| eval "Total boot IOs" = SumTotalBootProcIOReadCount + SumTotalBootProcIOWriteCount
| eval "Windows Updates IOs of total (%)" = round('Applying Windows Updates IO count' / 'Total boot IOs',1)

| sort - "Applying Windows Updates duration (s)"
| table
   host
   "Boot start time"
   BootUID
   "Applying Windows Updates duration (s)"
   "Total boot duration (s)"
   "Windows Updates duration of total (%)"
   "Applying Windows Updates IO count"
   "Total boot IOs"
   "Windows Updates IOs of total (%)"
Splunk Search Result
This is what the result looks like in Splunk’s UI:
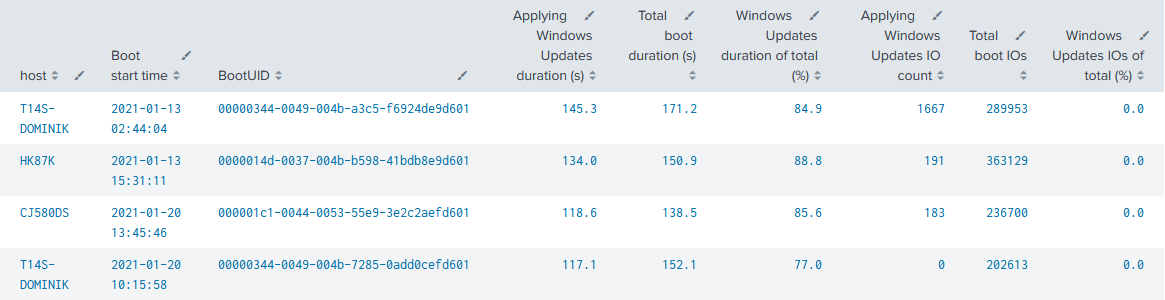
Example result for above search
Customize Using Filters
Above’s search gives you probably a long list back. By extending the search with the following line, the output can be filtered to computer startups where the Windows Update phase exceeds a certain value in seconds.
| where 'Applying Windows Updates duration (s)' > 60