Identifying Applications That Use 100% of a CPU Core
Some applications fully use one or multiple CPU cores, either because they are badly written or because they simply make such complex calculations. Back in the days of single-core CPUs, this was easy to detect: the machine’s CPU usage would spike to 100%. Today, even lightweight laptops have at least four physical cores, workstations many more. Looking at a machine’s or a process’ CPU usage percentage is not enough. You need to factor in the number of CPU cores in order to determine whether one or multiple cores are fully utilized. This article explains how to do that.
uberAgent determines the number of physical and logical CPU cores as part of its machine inventory metric. The resulting data is then added to all sourcetypes as additional fields during search time via automatic lookups. This means that you can use (nearly) all machine inventory fields in (nearly) all searches! The main exceptions are sourcetypes where the data does not apply to a specific endpoint, e.g., Citrix site or ADC metrics.
With that knowledge, we can build a simple search that lists processes that utilized at least a given number of CPU cores for the duration of a data collection interval (30 seconds by default):
index=`uberAgent_index` sourcetype=uberAgent:Process:ProcessDetail ProcCPUPercent>0
| eval CoresUsed = ProcCPUPercent * CPUCoresLogical / 100
| where CoresUsed > 0.8
| table _time, host, AppName, AppVersion, ProcName, CoresUsed, CPUCoresPhysical, CPUCoresLogical
In the example above, I filtered for events where one process used at least 80% of a CPU core (where CoresUsed > 0.8). The actual calculation of the number of cores used is simple: CoresUsed = ProcCPUPercent * CPUCoresLogical / 100. The last command, table, selects the fields to be displayed: application name, application version, process name, number of cores used, total number of physical and logical cores.
The result looks like this:
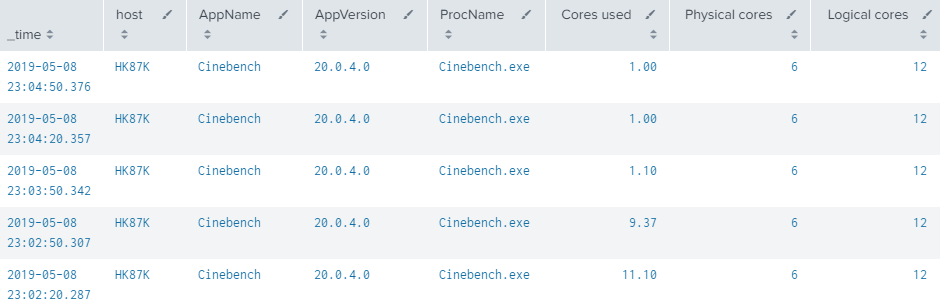
You may notice that I ran a CPU benchmark, Cinebench, to generate a high enough load. First I ran the multi-core, then the single-core benchmark. Please note that I renamed some fields to optimize formatting.