Detecting Network Connectivity Problems
Network connectivity issues severely impact application functionality and performance, yet are often difficult to diagnose. This practice guide demonstrates how uberAgent helps.
Network issues come in two flavors: permanent and intermittent. The following sections explain both in detail.
Permanent Network Connectivity Issues
Permanent issues are often caused by configuration errors. Examples:
- A server service was migrated to a new machine but the application configuration is still pointing to the old machine.
- Firewall rules are missing so application connectivity is blocked.
Intermittent Network Connectivity Issues
Intermittent issues only occur from time to time and may cause seemingly random application slowness or occasional application errors. Examples:
- Bad WiFi signal reception
- Packet loss
- Saturated internet connection
Diagnosing Network Connectivity Issues
uberAgent monitors all network traffic and enriches it with metadata like the originating application, the user account, the machine type, Active Directory OU, Citrix site, and much more. Network traffic is categorized as successful or failed connection, regular transmission or retransmit, and so on.
When suspecting network problems the dashboard to consult is Application Network Issues, located in the Applications menu.
Network Availability Indicator
The first thing to check is the Network availability metric:
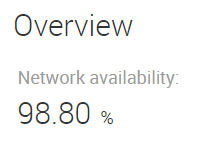
It is the ratio of successful connections and transmissions to the total number of connection and transmission attempts and should be at 100%.
Network Issues Over Time
The next thing to check are the timecharts in the section Issues grouped over time:
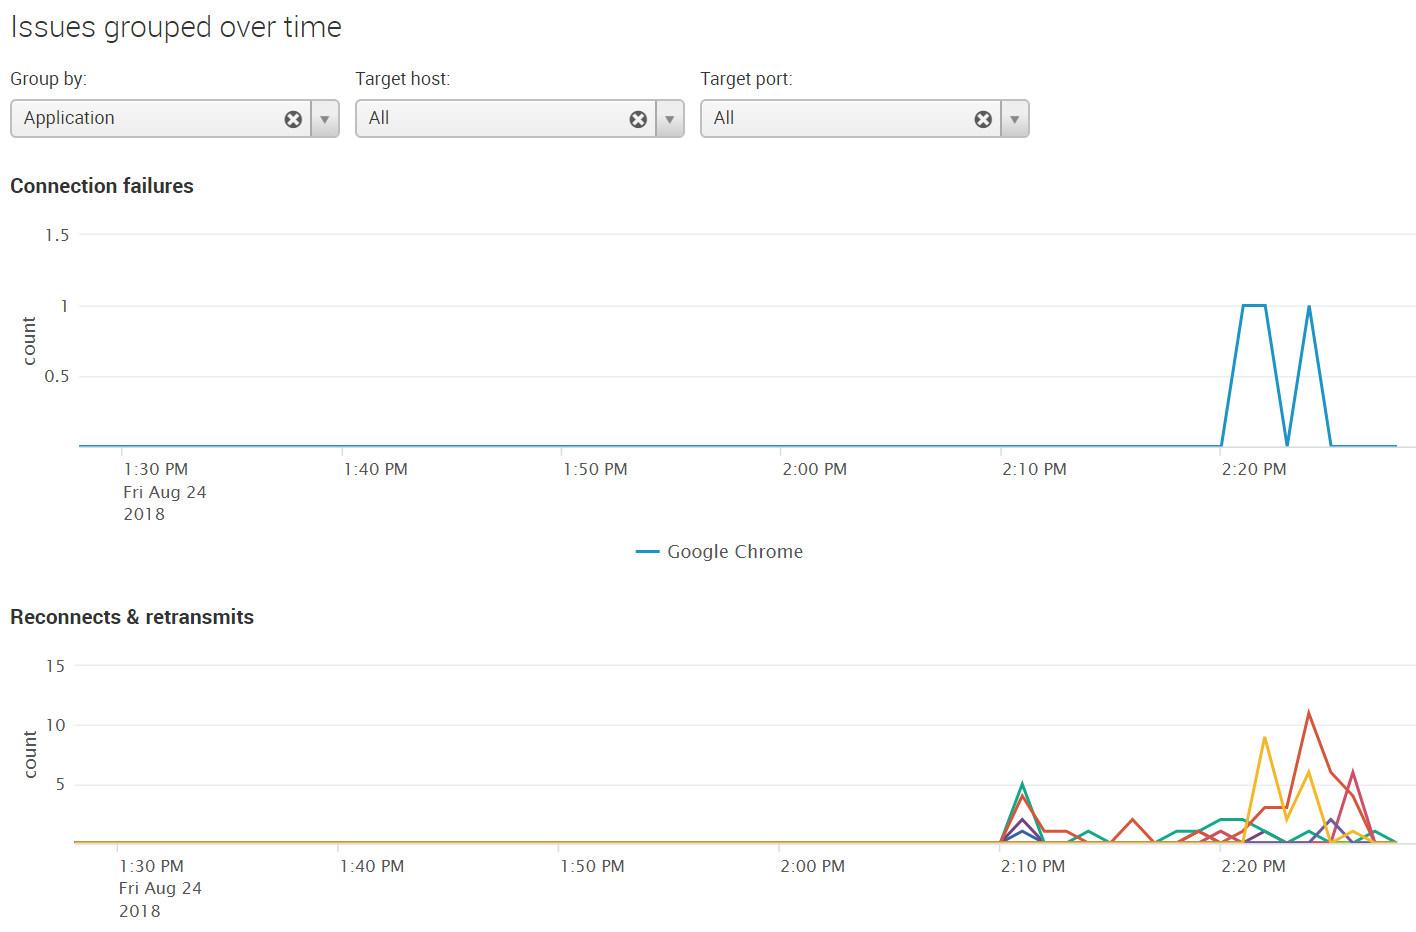
The two graphs show connection failures and reconnects & retransmits over the selected time range. By default both graphs group errors per application, but you can switch to errors per process, per source or target host, per target port or even per user.
Network Issues per Application
To further analyze the errors for a specific application (or host, user, etc.) click on the respective row of the table Issues grouped (top 100). This performs an in-page drilldown, bringing up an additional table and chart with details on the selected item:
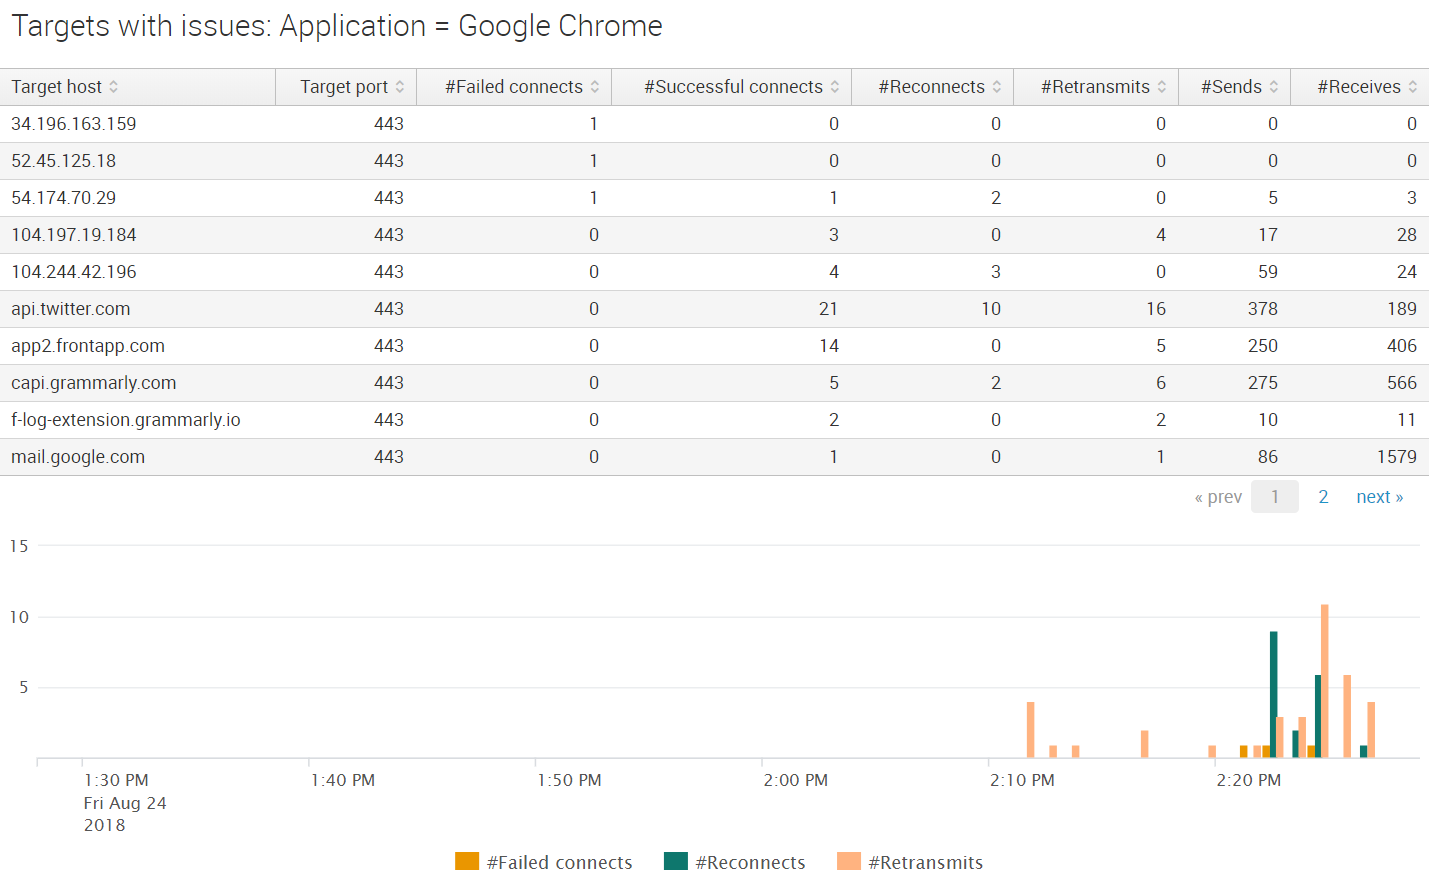
In the screenshot above we can see that reconnection and retransmission errors started at around 2:10 PM for the selected application (Google Chrome). The errors are not limited to specific target hosts. This indicates intermittent problems, most likely related to unstable internet connectivity.