uberAgent in the Helpdesk Pt. 1 – The Helpdesk App
We’re often asked how uberAgent can be used in helpdesk scenarios. We want to address this question with a series of practical blog posts. This first article of the series is about our helpdesk app. But let’s start at the beginning.
We recommend reading the articles in this series successively in the following order:
- uberAgent in the Helpdesk Pt. 1 – The Helpdesk app (this article)
- uberAgent in the Helpdesk Pt. 2 – The Experience Score Overview
- uberAgent in the Helpdesk Pt. 3 – The Score Dashboards
- uberAgent in the Helpdesk Pt. 4 – The Security Score
What Is uberAgent?
uberAgent has been on the market for over a decade. It consists of the two products uberAgent UXM, the digital employee experience monitoring software, and uberAgent ESA, which extends the use case to endpoint security analytics. As we’re focused on uberAgent UXM in this series, let’s quickly recap what the UXM actually does.
uberAgent UXM delivers exceptional insights into your IT landscape. It provides the information your help desk team needs to track down issues related to user experience or application performance and is essential in root cause analysis. Since you’re reading this blog post, you probably already have some knowledge of the metrics collected by the agent – but even so, it isn’t always easy to figure out where to start the troubleshooting process. This article shows you where to begin.
Where To Start Troubleshooting With uberAgent?
Anyone who has ever worked at an IT help desk knows and “loves” users calling with the following: “My computer is so slow today” – potentially adding: “again.”
This complaint does not contain much information, does it? To even begin troubleshooting, you need to identify which component negatively affects the machine’s performance. It could be any of the following: the user’s device, a remote server, an application, or a misconfiguration, to name just a few.
Why Use uberAgent’s Helpdesk App?
Since the user didn’t give us much information to work with, the first step would be to determine what they are actually doing. You could, of course, browse through all our dashboards and try to identify the issue by analyzing it from different perspectives. This approach is good if you want to dig deeper. However, uberAgent’s wide function range might be too comprehensive for the typical first-level support scenario.
To save valuable time, we offer our very own Swiss army knife, the uberAgent helpdesk app. What makes it even better is that it’s free of charge for our customers! While the app itself is not new, we’re always updating it when we add new relevant metrics to the main uberAgent apps.
The app requires a single step: entering the username or the device name. With that information, the app displays all the information necessary to get an overview. In this blog article, we want to give you a glimpse of what that is.
What Functionalities Does the Helpdesk App Offer?
Remoting & Machine Details
Detect from where a user session was initiated by looking at the Remoting details. This panel highlights information about the client from where the session was started, such as the IP address, the operating system, or the client’s name. uberAgent also detects which remoting technology and screen resolution are used.
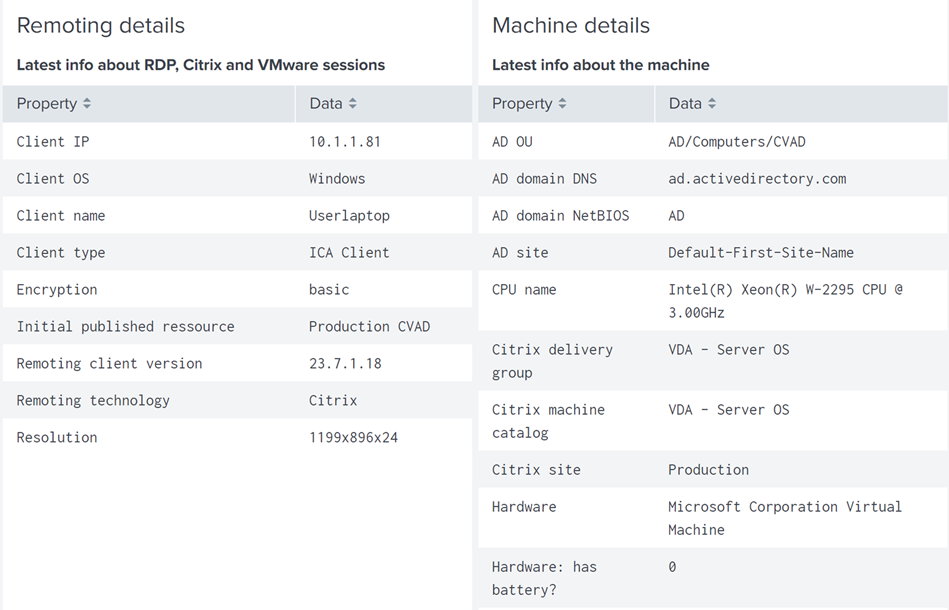
Next to the remoting info, you can find details about the host the session is running on. This includes Active Directory information such as domain, OU, and site name, as well as Citrix properties such as delivery group, machine catalog, or Citrix site names.
Citrix Info & Logon Duration
The Session connection changes table shows how the user changed client devices and roamed the session between endpoints. This information is extremely helpful in understanding why users might complain about poor performance at a specific point in time.
The Citrix information is rounded off by two panels that display the actual Citrix settings and the applied Citrix policies, respectively. With that, the helpdesk technician has all the necessary information to determine if there’s a misconfiguration.
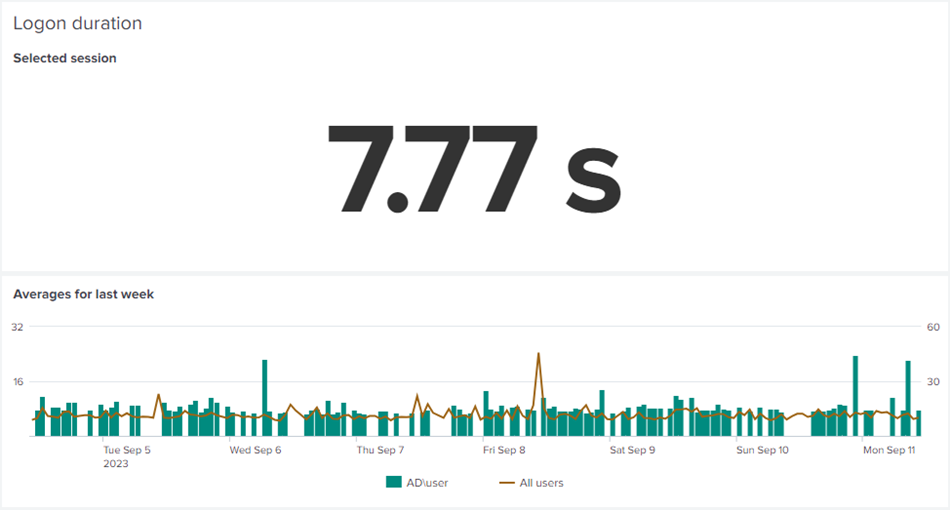
Session performance (literally) starts with user logon duration. By showing the current user session’s logon duration in relation to the average from all users, the app provides a simple but effective way to gauge if the logon process warrants further analysis.
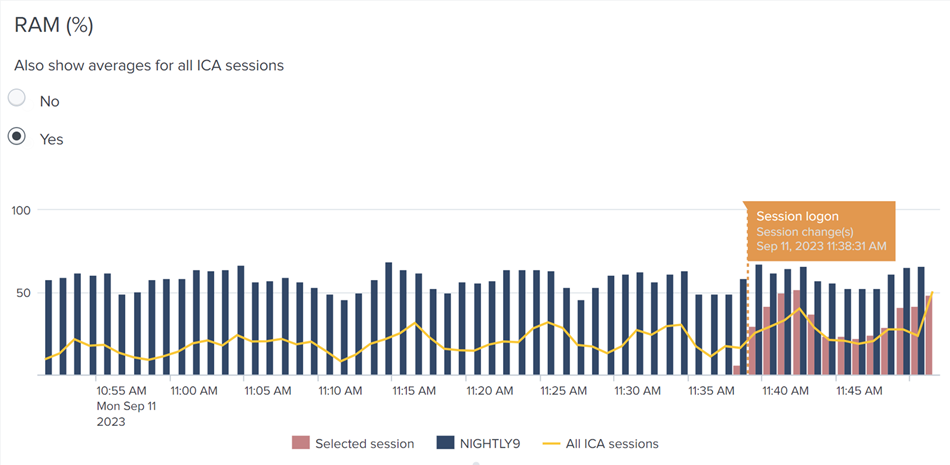
In the same way the dashboard relates key performance metrics of the current session to either other sessions on the same host or even all sessions where the same remoting protocol is used. This helps to quickly identify resource constraints and performance hogs.
Another boon for Citrix troubleshooting: the helpdesk app highlights how ICA latency and round-trip time (ms) have changed over time. Again, the dashboard lets you compare the values of the selected session to all sessions on the host or to the entire estate.
Remoting protocols such as Citrix HDX exchange a lot of data between the client and the server by means of virtual channels. Slow printing, for example, can often be attributed to network saturation. The app helps you identify such cases by listing the virtual channel data volume for the selected session on a per-channel basis, and comparing it to the average values from other sessions on the same host.
Application Usage
Finally, uberAgent’s helpdesk app shows which applications are used along with each app’s resource footprint. If you’ve deployed uberAgent’s browser extension, too, the dashboard can even show which browser tabs the user interacted with.
Streamline Your Troubleshooting
Depending on the results of your initial analysis, you may need to take a closer look at our more detailed dashboards. If you find that the user is experiencing poor performance with a particular application, you might want to continue the analysis with the Application Performance dashboard. If, on the other hand, you’ve noticed that logins slow, looking at uberAgent’s User Logon Duration and Single Logon dashboards will help you determine what’s causing the delay.
Conclusion
The main benefit of using the helpdesk app is that it helps you quickly find out where an issue originates from and/or which components are involved in a user session that is affected by a problem.
The helpdesk app is a great starting point for your per-machine or per-user troubleshooting as it points you in the right direction. If you want to have a look at your whole environment instead of only a single user or endpoint, we recommend using uberAgent UXM’s user/application/machine score dashboards in combination with the overarching Experience Score dashboard. Find out more about these dashboards in the next articles of the series.
About uberAgent
The uberAgent product family offers innovative digital employee experience monitoring and endpoint security analytics for Windows and macOS.
uberAgent UXM highlights include detailed information about boot and logon duration, application unresponsiveness detection, network reliability drill-downs, process startup duration, application usage metering, browser performance, web app metrics, and Citrix insights. All these varied aspects of system performance and reliability are smartly brought together in the Experience Score dashboard.
uberAgent ESA excels with a sophisticated Threat Detection Engine, endpoint security & compliance rating, the uAQL query language, detection of risky activity, DNS query monitoring, hash calculation, registry monitoring, and Authenticode signature verification. uberAgent ESA comes with Sysmon and Sigma rule converters, a graphical rule editor, and uses a simple yet powerful query language instead of XML.
About vast limits
vast limits GmbH is the company behind uberAgent, the innovative digital employee experience monitoring and endpoint security analytics product. vast limits’ customer list includes organizations from industries like finance, healthcare, professional services, and education, ranging from medium-sized businesses to global enterprises. vast limits’ network of qualified solution partners ensures best-in-class service and support anywhere in the world.


