Visualizing uberAgent Data in Azure Monitor—Part 1: Basics
uberAgent ships with more than 60 Splunk dashboards to visualize its comprehensive data set. In addition to Splunk, uberAgent has been supporting Elasticsearch, Kafka, and Azure Monitor as alternative backends for a long time. While the data uberAgent sends to these backends is identical to the data sent to Splunk, we do not provide dashboards.

Why Are There No Dashboards for Elastic, Kafka and Azure Monitor?
Well, the answer we have given over the last years has always been the same, because nothing has changed in the following: Splunk’s visualization capabilities are miles ahead of all other backends!
Why Are We Writing This Article for Azure Monitor?
While we only got few requests for dashboards for the other platforms in the past, we noticed an increased interest in the last few months for uberAgent dashboards for Azure Monitor. And that makes sense. More and more companies are moving to Microsoft 365. And if they weren’t Azure customers before, they are automatically now and keen to explore what to do with that service.
Time to Re-Evaluate Azure Monitor’s Dashboarding Capabilities
In the last weeks we have dealt with the subject in detail and I’m going to publish our findings in a four-part blog series.
The blog-series is split as follows:
- First part (this article): the basics
- introduction to the topic
- how to send uberAgent data to Azure Monitor
- Kusto vs. SPL
- the first Kusto search
- Second part: comparing the dashboarding capabilities of Azure Monitor and Splunk
- Third part: using Grafana with Azure Monitor for uberAgent
- Fourth part: conclusion
My Setup
For this blog-series, I worked with the following versions. Your results may differ if you test with other versions.
- uberAgent 6.0 Beta
- Splunk Enterprise 8.0.1
- Grafana 6.6.0
- There is no Azure Monitor version, as it is a cloud service. I tested with what was available in April 2020.
How to Send uberAgent Data to Azure Monitor
The first step is to have uberAgent data available in Azure Monitor (AM). AM supports two ways of storing data:
- Metrics
- Logs
uberAgent supports AM Logs only. When I’m writing about AM in this blog-series I’m always referring to AM Logs if not stated otherwise.
How to get data into AM is well described in our docs. I suggest heading over there and reading the article completely before returning here.
The name changed from Microsoft OMS Log Analytics to Azure Log Analytics to Azure Monitor Logs over time. Despite being an older term, one finds Azure Log Analytics still in articles today.
More confusion: the resource in Azure where you store logs is called Log Analytics Workspace.
uberAgent is using Azure’s HTTP Data Collector API to send data to AM. The API is still in preview. This is primarily the reason why the entire uberAgent AM integration is marked with experimental support in our docs.
Kusto vs. SPL
Now that you have uberAgent data in AM, you can search it. But how?
Searching is done in a specific language. Before we start comparing the dashboarding capabilities, we have to look at the search language. If AM’s language would be lacking some important features of Splunk’s, we could stop here.
Splunk developed its own search language SPL, short for Search Processing Language. AM has its own language, too. It’s called Kusto.
Luckily, Microsoft created a nice comparison article. All functions, operators, and filters we are utilizing in our dashboard’s searches are available in Kusto, too. One thing bothers me, though. Kusto is not able to work with wildcards in comparisons. You have to work with regex, which ups the complexity unnecessarily.
While Kusto is quite powerful, AM is lacking some advanced features we are using in Splunk. Saved searches, macros, data models – to name a few. Since these features are missing, we cannot map everything we have in Splunk to AM. For example, we automatically extend all Splunk source types with fields from our machine inventory to be able to filter or group in searches for these fields.
The First Kusto Search
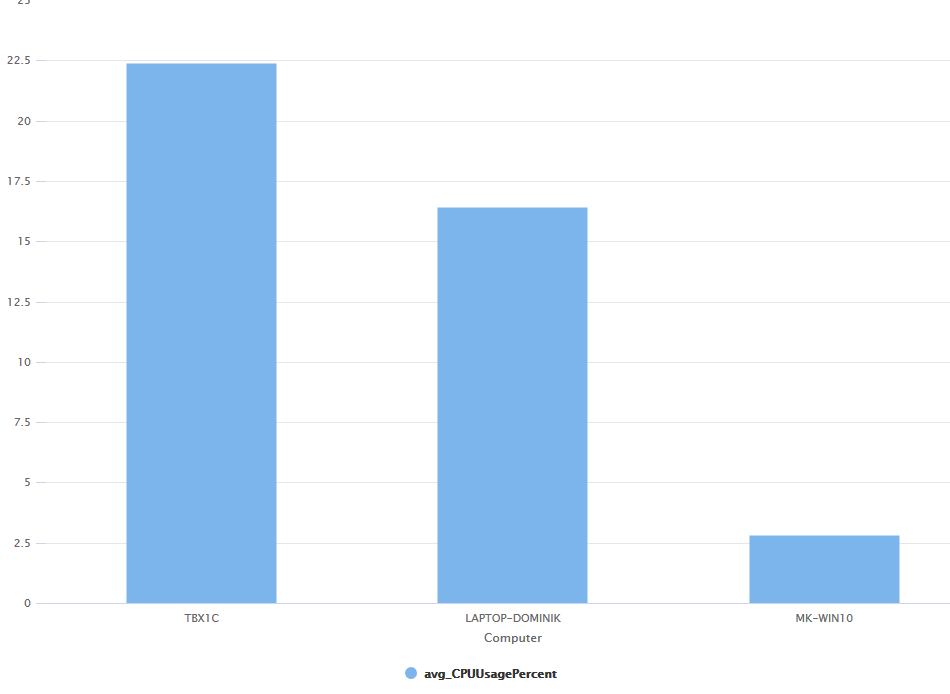
It’s time to create our first Kusto search. Our goal is to list the average CPU usage per machine for the last hour. We only want the top 10.
Search in the uberAgent database and in the table which holds the performance data for machines:
uberAgent_System_SystemPerformanceSummary2_CLWe are only interested in the last hour:
| where TimeGenerated > ago(1h)Get the average CPU usage per machine:
| summarize CPUUsagePercentRaw = avg(CPUUsagePercent_d) by ComputerWe should round that number to make it easier to read:
| extend avg_CPUUsagePercent = round(CPUUsagePercentRaw, 1)We are only interested in the top 10:
| top 10 by avg_CPUUsagePercentOutput only the machine name and the rounded CPU usage. We don’t need the field CPUUsagePercentRaw in our output:
| project Computer, avg_CPUUsagePercentThe complete search in Kusto:
uberAgent_System_SystemPerformanceSummary2_CL
| where TimeGenerated > ago(1h)
| summarize CPUUsagePercentRaw = avg(CPUUsagePercent_d) by Computer
| extend avg_CPUUsagePercent=round(CPUUsagePercentRaw, 1)
| top 10 by avg_CPUUsagePercent
| project Computer, avg_CPUUsagePercent
If you add | render barchart at the end the result will be shown in a nice chart.
SPL
As a comparison the complete search in SPL:
index=uberagent sourcetype=uberAgent:System:SystemPerformanceSummary2 earliest=-1h
| stats avg(CPUUsagePercent) as CPUUsagePercentRaw by host
| eval avg_CPUUsagePercent=round(CPUUsagePercentRaw, 1)
| sort - avg_CPUUsagePercent limit=10
| fields host, avg_CPUUsagePercent
As you can see, the searches are very similar.
Read On…
That’s it for today. In the next part, I’m going to compare AM’s built-in visualizations with Splunk’s.
About uberAgent
The uberAgent product family offers innovative digital employee experience monitoring and endpoint security analytics for Windows and macOS.
uberAgent UXM highlights include detailed information about boot and logon duration, application unresponsiveness detection, network reliability drill-downs, process startup duration, application usage metering, browser performance, web app metrics, and Citrix insights. All these varied aspects of system performance and reliability are smartly brought together in the Experience Score dashboard.
uberAgent ESA excels with a sophisticated Threat Detection Engine, endpoint security & compliance rating, the uAQL query language, detection of risky activity, DNS query monitoring, hash calculation, registry monitoring, and Authenticode signature verification. uberAgent ESA comes with Sysmon and Sigma rule converters, a graphical rule editor, and uses a simple yet powerful query language instead of XML.
About vast limits
vast limits GmbH is the company behind uberAgent, the innovative digital employee experience monitoring and endpoint security analytics product. vast limits’ customer list includes organizations from industries like finance, healthcare, professional services, and education, ranging from medium-sized businesses to global enterprises. vast limits’ network of qualified solution partners ensures best-in-class service and support anywhere in the world.


