Visualizing uberAgent Data in Azure Monitor—Part 3: Grafana
Welcome back to our four-part blog series about visualizing uberAgent data in Azure Monitor. So far you have learned the basics about Azure Monitor and the search language Kusto. You created your first Kusto search as well. Also, you learned that none of the built-in visualization options can compete with Splunk. This is part three.
The blog-series is split as follows:
- First part: the basics
- Second part: comparing the dashboarding capabilities of Azure Monitor and Splunk
- Third part (this article): using Grafana with Azure Monitor for uberAgent
- Grafana installation and configuration
- Creating uberAgent’s Machine Performance Dashboard in Grafana
- Fourth part: conclusion
What Is Grafana?
Grafana is an open-source analytics and monitoring solution. It connects to your Azure LogAnalytics workspace (or other data sources). That means your data is stored only once, in Azure, and you don’t have to replicate it to Grafana. The Kusto searches are written in Grafana, however. It has auto-complete and everything!
Install Grafana
You can either install Grafana locally in your data center or get it from Azure.
Set Up Grafana Locally
Grafana is available for a variety of operating systems. Choose your preferred. The installation is very well documented. I went with the following to install Grafana on Ubuntu.
# Install
sudo apt-get install -y apt-transport-https
sudo apt-get install -y software-properties-common wget
wget -q -O - https://packages.grafana.com/gpg.key | sudo apt-key add -
echo "deb https://packages.grafana.com/enterprise/deb stable main" | sudo tee -a /etc/apt/sources.list.d/grafana.list
sudo apt-get update
sudo apt-get install grafana

# Start service
sudo systemctl daemon-reload
sudo systemctl start grafana-server
sudo systemctl status grafana-server

# Configure the Grafana server to start at boot
sudo systemctl enable grafana-server.service
Set Up Grafana on Azure Through the Azure Marketplace
If you prefer to have everything in Azure you can get Grafana from the Azure Marketplace. The installation is documented by Microsoft.
Configure Grafana
Now it’s time to configure Grafana to connect to your LogAnalytics workspace. First, browse to http://<IP address>:3000 and login with admin as username and password.
Create a Service Principal
Grafana uses an Azure Active Directory service principal to connect to the Azure Monitor APIs and to collect data from your LogAnalytics workspace. Creating a service principal includes a lot of clicking in the Azure Portal. Documenting it here would make this article longer than it already is. Please read this article instead.
Make note of the following for the next step:
- Directory (tenant) ID
- Application (client) ID
- Client secret
Configure The Azure Monitor Data Source
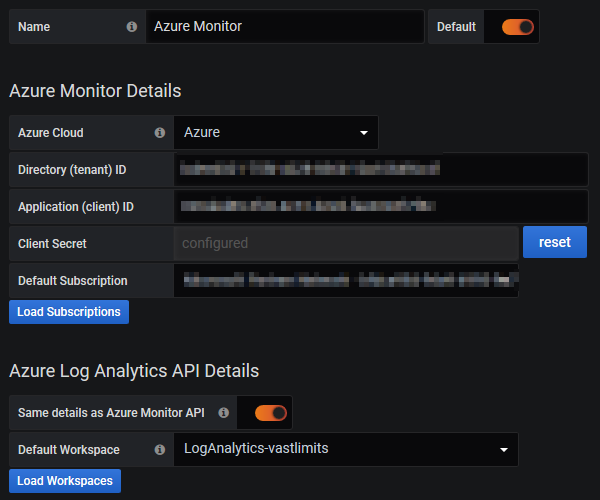
In Grafana browse to Configuration > Data Sources and click on Add data source, and Azure Monitor.
Enter a name and your notes from the last step.
- Azure Cloud: Azure
- Directory (tenant) ID: The Directory (tenant) ID you noted while creating the Service Principal
- Application (client) ID: The Application (client) ID you noted while creating the Service Principal
- Client Secret: The secret you noted while creating the Service Principal
Click on Load Subscriptions and choose the subscription in which your uberAgent LogAnalytics workspace is located.
Under Azure Log Analytics API Details select Same details as Azure Monitor API and your uberAgent LogAnalytics workspace as default.
Click on Save & Test.
Creating uberAgent’s Machine Performance Dashboard in Grafana
Shall we finally start creating the first dashboard? Let’s!
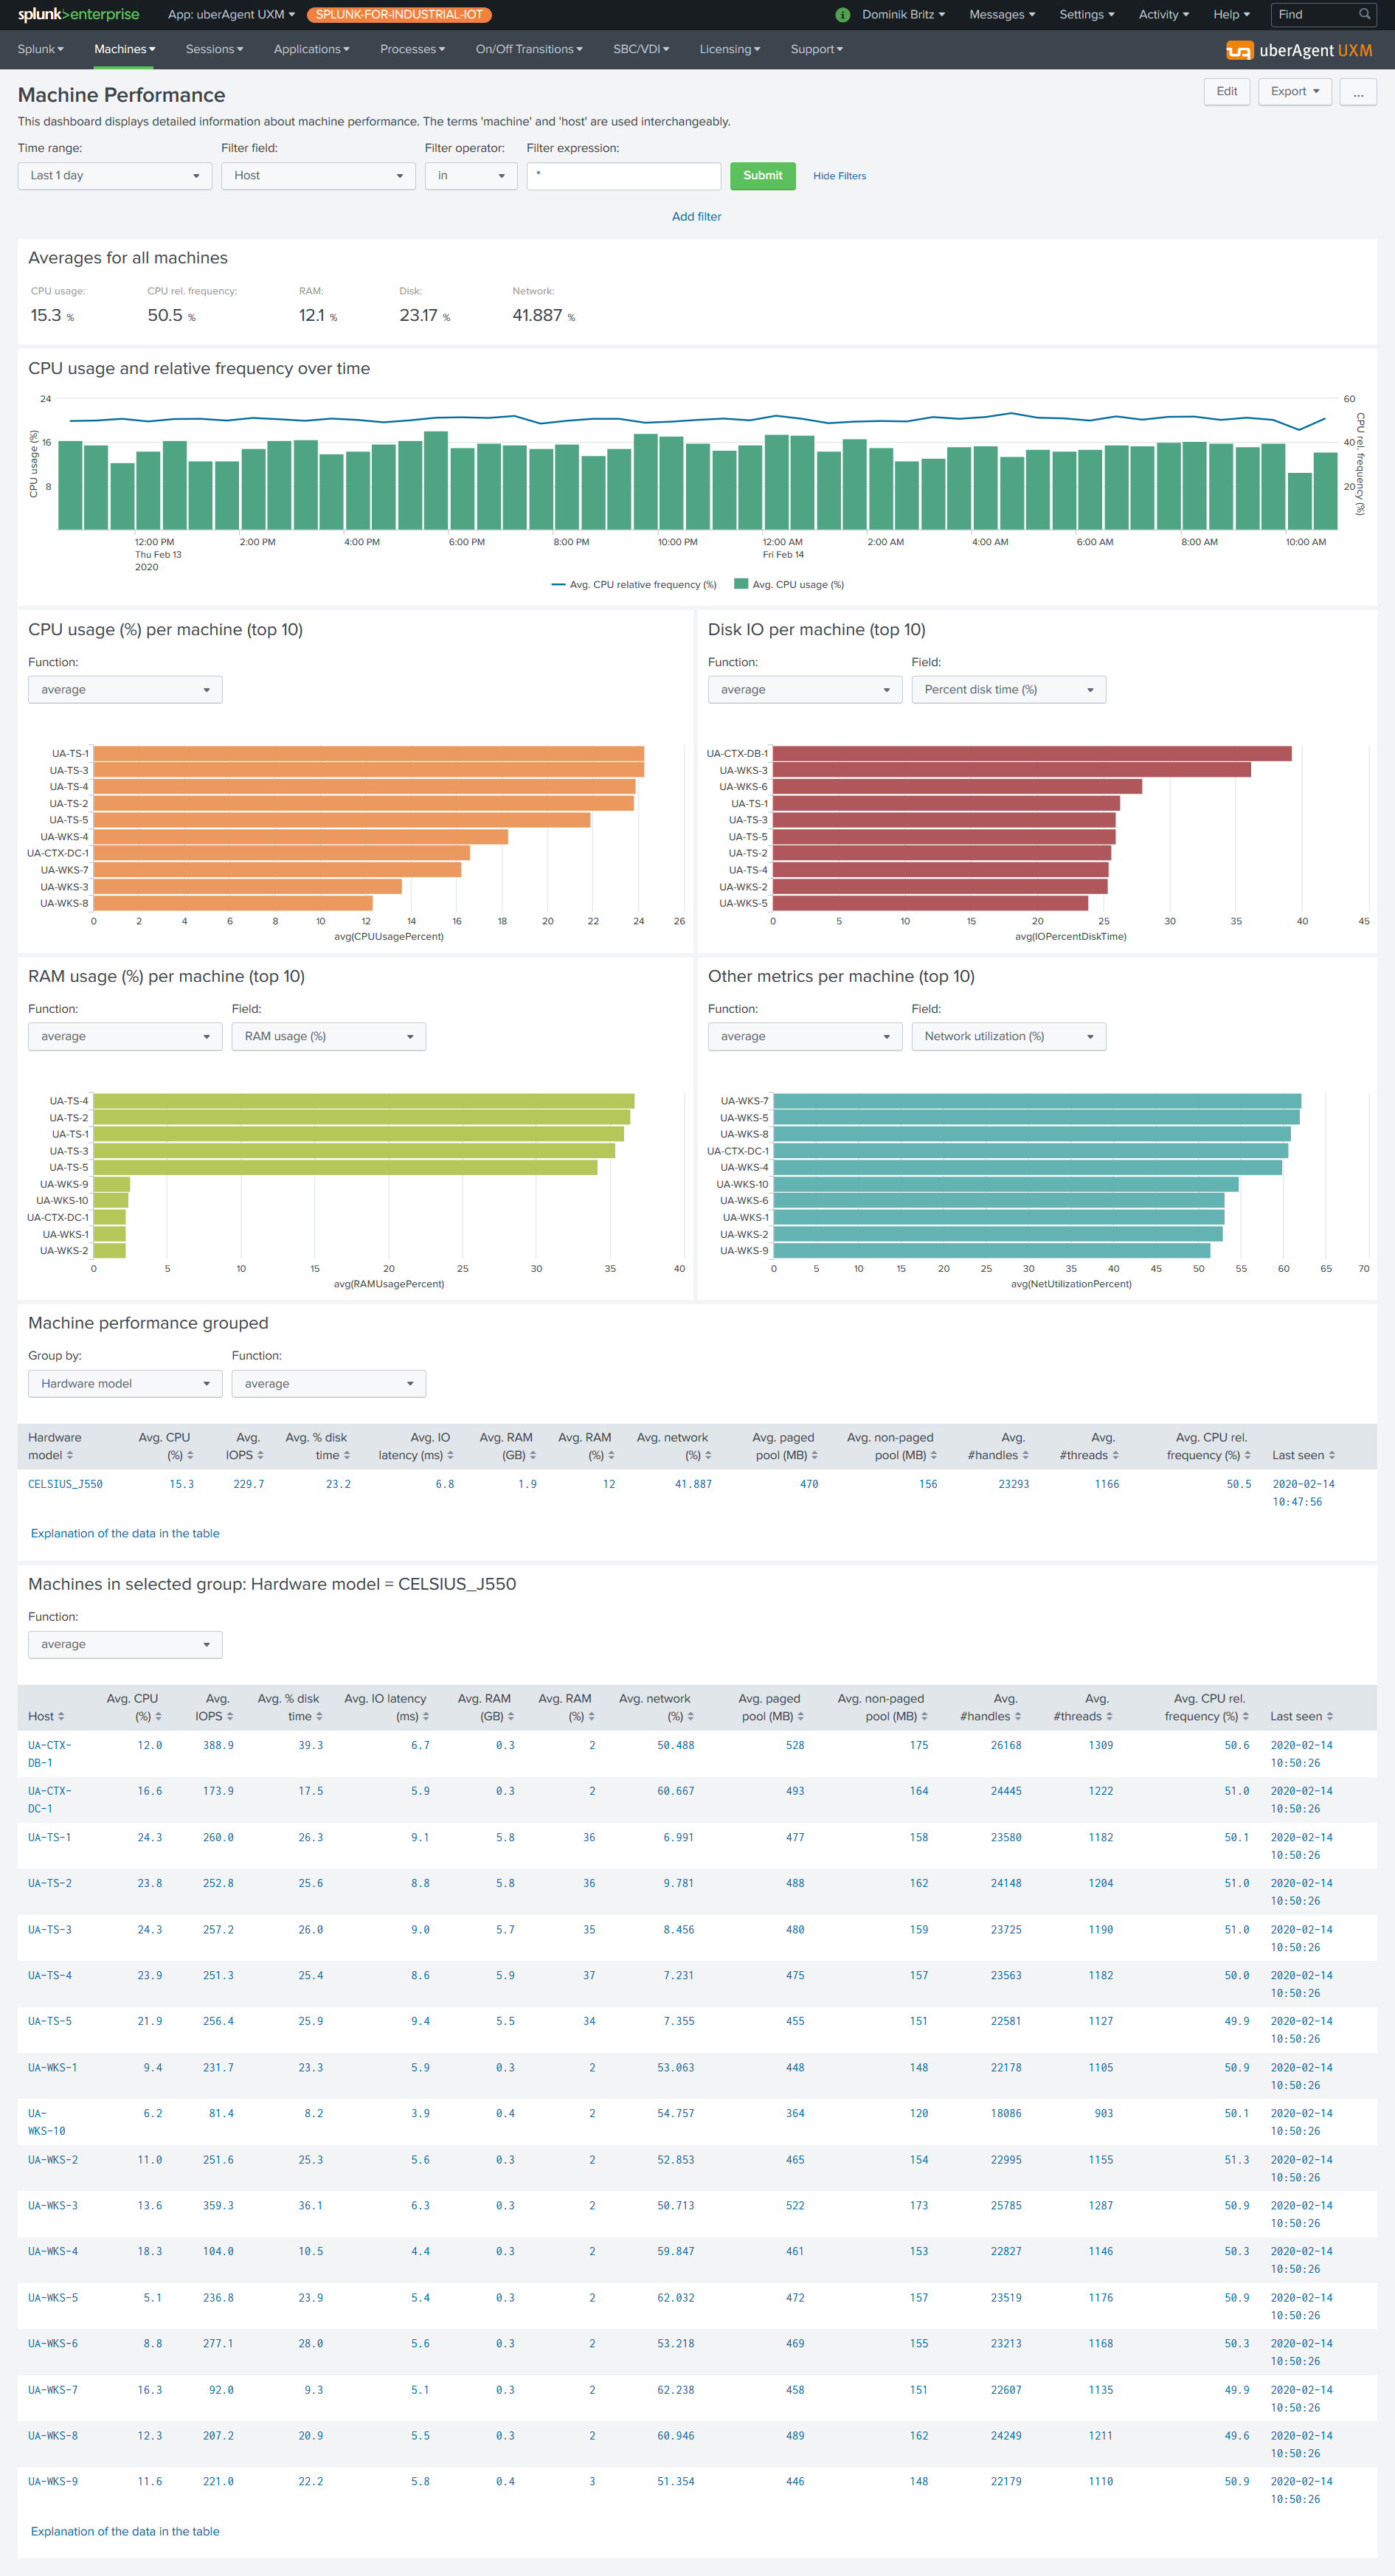
Machine Performance Dashboard in Splunk. Click to enlarge.
Our goal is to copy uberAgent’s Machine Performance Dashboard from Splunk to see what’s possible in Grafana and what’s not. However, documenting everything here would be too much. I will give a few examples instead and share the complete dashboard as a download at the end of this article.
Variables
As mentioned in part two, we want the dashboard to be flexible. We will use dashboard variables in Grafana to add some flexibility.
Click on Dashboard Settings, choose Variables from the menu and click New.
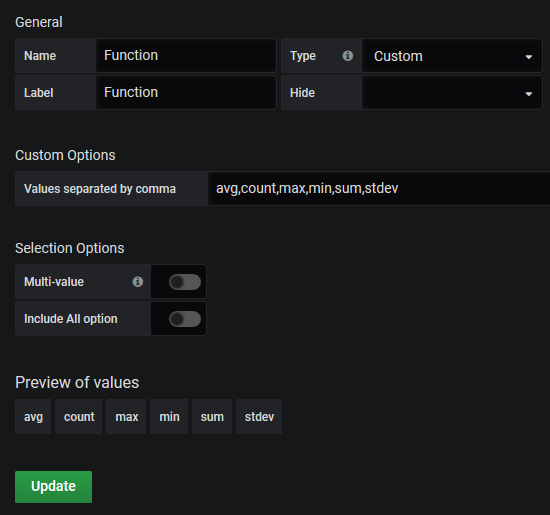
The first variable $Function allows us to choose between averages, counts, etc. in charts. Enter the following:
- Name: Function
- Type: Custom
- Label: Function
- Values separated by comma:
avg,count,max,min,sum,stdev

The second variable $Computer allows us to filter the dashboard to specific computers. By default, we want to see data for every computer. As Kusto doesn’t allow wildcards in comparisons, we have to go with regular expressions.
- Name: Computer
- Type: Text box
- Label: Computer
- Default value:
.*
The First Chart: CPU Usage
The first chart we try to copy is CPU usage (%) per machine (top 10).
- Click on Add panel and choose Add Query
- Add the following search in the query editor. Note that we use our two variables by surrounding them with brackets. Also, we make use of the Grafana macro
$__timeFilter(TimeGenerated)to take thefromandtodatetimes from the Grafana time picker.
uberAgent_System_SystemPerformanceSummary2_CL
| where $__timeFilter(TimeGenerated)
| where Computer matches regex '[[Computer]]'
| summarize CPUUsagePercentRaw = [[Function]](CPUUsagePercent_d) by Computer
| extend [[Function]]_CPUUsagePercent=round(CPUUsagePercentRaw, 1)
| order by [[Function]]_CPUUsagePercent
| project Computer, [[Function]]_CPUUsagePercent- Change to the visualization tab and choose the Bar Gauge
- Show: All Values
- Limit: 10
- Orientation: Horizontal
- Mode: Gradient
- Unfilled: Yes
- Title:
$__cell_0(another Grafana macro) - Unit: percent (0-100)
- Min: 0
- Max: 100
- Decimals: 1
- Thresholds: No thresholds. Choose green as the color.
- Go to the general tab and enter the following
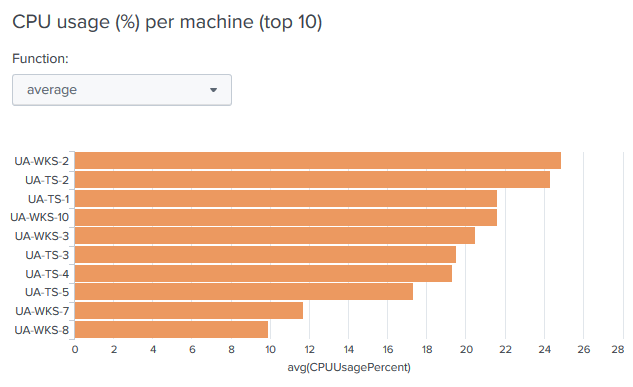
- Title: CPU usage (%) per machine (top 10)
- Save the dashboard
The result looks promising!

The devil is in the details, though. Variables in Grafana apply to the whole dashboard. We used the dashboard variable $Function for our chart. All other charts must also use this variable, or you must define a variable for each chart. The latter would become confusing quickly, especially for more complex charts where several variables are needed.
In Splunk, we have variables everywhere. Per row, per panel, and even per chart. We make use of this a lot in our Splunk dashboards as it allows changing the aggregation function as well es the field directly in a chart:
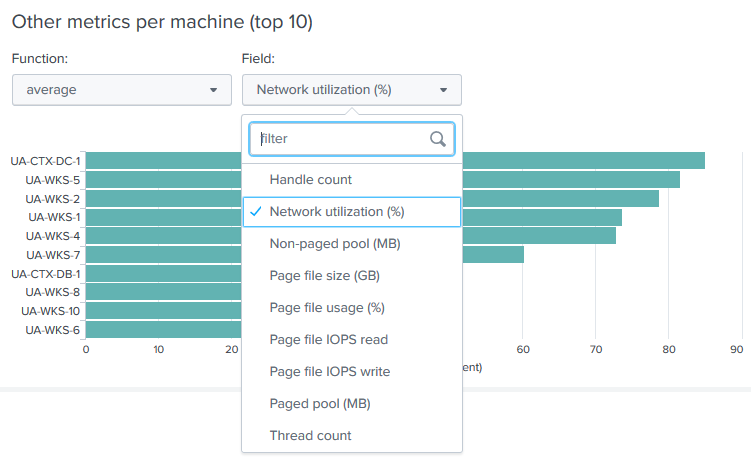
Playing With Drilldowns
In part two of this series, I explained why we need drilldowns. Let’s create one in our Grafana dashboard.
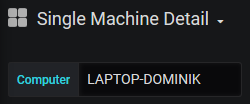
Create The Target Dashboard
Of course, the drilldown in our dashboard has to open something. Hence we create the target dashboard first. We call it Single Machine Detail.
- Create the dashboard
- Click on Dashboard Settings, choose Variables from the menu and click New
- Create the variable
$Computer- Name: Computer
- Type: Text box
- Label: Computer
- Default value:
.*

That is already enough for what we want to prove. Note down the URL part after the server name and port until the first question mark. We need that in the next step. For me, it is d/iW9KKOUWz/single-machine-detail.
Create The Drilldown
Go back to the Machine Performance Dashboard.
- Click on Add panel and choose Add Query
- Add the following search in the query editor
uberAgent_System_SystemPerformanceSummary2_CL
| where $__timeFilter(TimeGenerated)
| where Computer matches regex '[[Computer]]'
| summarize
   ["[[Function]]. CPU (%)"] = round([[Function]](CPUUsagePercent_d),1),
   IOPSRead = [[Function]](IOPSRead_d),
   IOPSWrite = [[Function]](IOPSWrite_d)
   by Computer
| extend ["[[Function]]. IOPS"] = round(IOPSRead + IOPSWrite,1)
| project-away IOPSRead, IOPSWrite
| order by Computer asc- Format As: Table
- Change to the visualization tab and choose the Table
- Table Transform: Table
- Apply to columns named: Computer
- Render value as link: True
- Url:
d/iW9KKOUWz/single-machine-detail?var-Computer=${__cell:raw}&from=$__from&to=$__to

What is that URL?
- d/iW9KKOUWz/single-machine-detail: the part from the URL I noted down before. Of course, the dashboard ID will be different in your case.
- var-Computer=${__cell:raw}: pass the variable
$Computerto the next dashboard with the raw content of the clicked table cell - from=$__from: set the dashboard’s timeframe to start at where our current dashboard started
- from=$__to: set the dashboard’s timeframe to end at where our current dashboard ended
Now when you click on one of the computers in the table the single machine detail dashboard opens and our $Computer variable which we created earlier gets updated successfully.

No In-Page Drilldowns
Unfortunately, drilldowns to new dashboards are the only option in Grafana. While they are needed in some cases, in-page drilldowns are far more elegant and therefore preferred in most cases.
There is no option to show/hide a row/panel/chart depending on a variable, either. That would be needed for in-page drilldowns.
Download The Dashboard
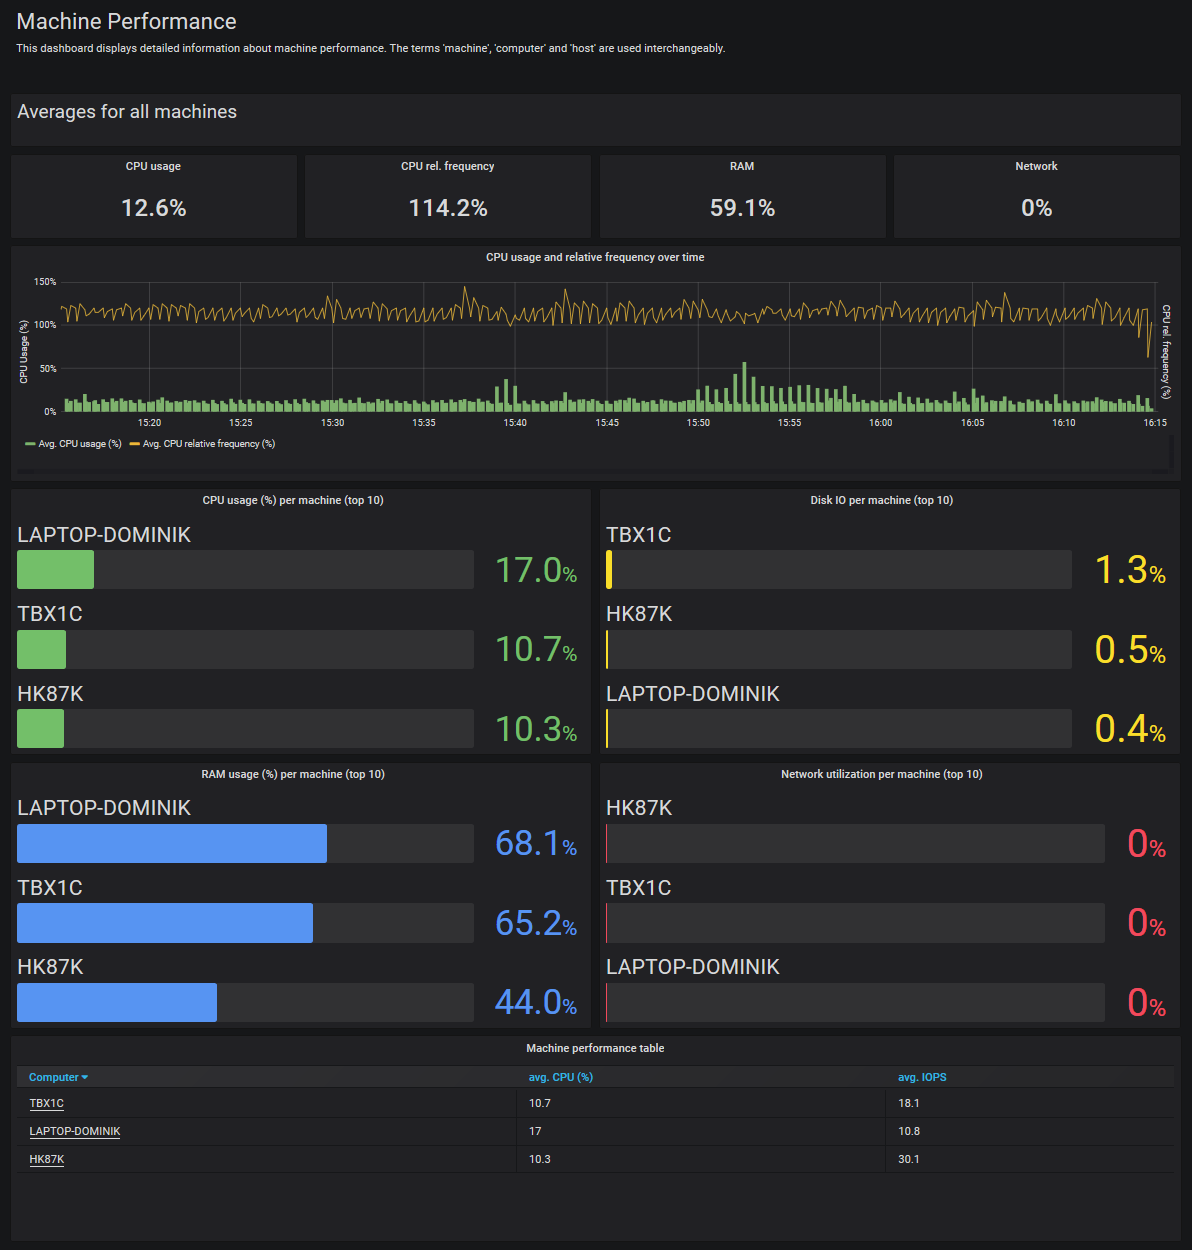
Full dashboard in Grafana. Click to enlarge.
Please find the example dashboard as a JSON file here. Before importing, add your directory (tenant) ID as value for the subscription setting.
"queryType": "Azure Log Analytics",
"refId": "A",
"subscription": "Your directory (tenant) ID here"
Grafana: a Conclusion
I enjoyed working with Grafana during my research. Every setting is available in a nice UI, but you can work in JSON or JavaScript if you want to. Sadly, it does not meet all our requirements, either. Here is the full list.
Requirements
- Interactivity
- Drill down to new dashboard: yes
- Drill down on the same dashboard: no
- Filtering
- Partly, through variables
- Filtering based on queries only available for AM Metrics at the moment
- Powerful charts
- Good looking: yes
- Resize and rearrangeable: yes
- Customizable: yes
- Different charts: yes
- Variables and parameters
- Yes
- Packaging as an app
- Yes
- JavaScript support
- Only for dashboard creation. No JavaScript framework to manipulate objects on the fly.
- You can create charts completely in JavaScript as a third-party vendor. That requires a lot of effort, though.
Downsides
There are a few more downsides which are worth mentioning:
- No Azure integration. You can’t manage dashboards and models through Azure Resource Manager.
- Cost to support additional Grafana infrastructure or additional cost for Grafana Cloud.
- Alerting available for the graph chart only.
- Grafana Enterprise needs a separate license (required for support, access to all plugins, permission management).
Update 2023-01-23
Grafana Labs is actively developing Grafana and talking about it on social media and blogs. However, the feature we would most like to see, drilldowns on the same dashboard, is still not available almost three years after the article was published. And we’re not the only ones waiting for the feature, as you can see in this GitHub issue. In the thread, a Grafana developer mentions that they are working on a new dashboard engine which should support the feature (source).
About uberAgent
The uberAgent product family offers innovative digital employee experience monitoring and endpoint security analytics for Windows and macOS.
uberAgent UXM highlights include detailed information about boot and logon duration, application unresponsiveness detection, network reliability drill-downs, process startup duration, application usage metering, browser performance, web app metrics, and Citrix insights. All these varied aspects of system performance and reliability are smartly brought together in the Experience Score dashboard.
uberAgent ESA excels with a sophisticated Threat Detection Engine, endpoint security & compliance rating, the uAQL query language, detection of risky activity, DNS query monitoring, hash calculation, registry monitoring, and Authenticode signature verification. uberAgent ESA comes with Sysmon and Sigma rule converters, a graphical rule editor, and uses a simple yet powerful query language instead of XML.
About vast limits
vast limits GmbH is the company behind uberAgent, the innovative digital employee experience monitoring and endpoint security analytics product. vast limits’ customer list includes organizations from industries like finance, healthcare, professional services, and education, ranging from medium-sized businesses to global enterprises. vast limits’ network of qualified solution partners ensures best-in-class service and support anywhere in the world.


