uberAgent 7: Next-Level Citrix Monitoring, MITRE ATT&CK Integration, Process Statistics
We are happy to announce the newest version of our digital employee experience monitoring & endpoint security analytics product. uberAgent 7.0 comes with so many new and improved features that it feels like a rebirth. We didn’t stop at product (r)evolution, though. We also implemented a much more rigorous testing infrastructure, which helped us further enhance the quality, stability, and reliability of uberAgent.
For a full list of changes, please consult the release notes. As always, upgrading is highly recommended (instructions).
uberAgent UXM
Citrix Session Monitoring
uberAgent has always provided exceptional insights into Citrix environments. Its logon monitoring capabilities alone make it one of the most exciting tools for Citrix admins. With uberAgent 7.0, we’re making Citrix monitoring even better. The new version provides unprecedented visibility into what’s happening on the session level: bandwidth usage, protocol latency, Citrix policies, video encoding settings, and much more.
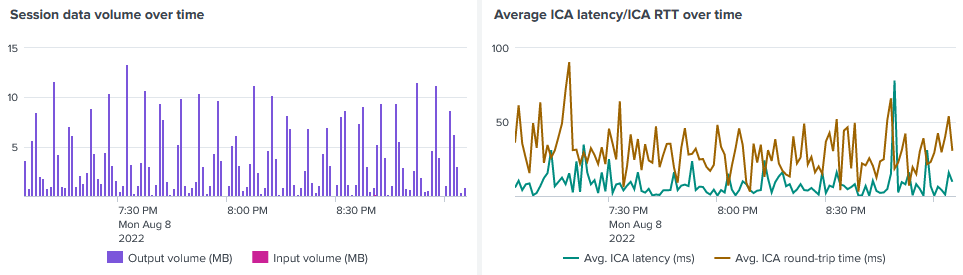
See this blog post for details on Citrix session monitoring.
Process Statistics: Handles, Priority & More
A solid set of process performance metrics that is well-suited to analyze and troubleshoot many issues related to application performance is at the very heart of uberAgent’s functionality. As we heard from our customers, there are use cases where additional information is needed. Collecting more data about every running process, however, requires careful consideration because there are so many of them. Typical Windows machines easily have 200-300 active processes at any given point in time. Multiply that by 25,000 (the typical number of monitored machines for many of our customers), and you realize how many additional data points would need to be processed in the backend when more fields are added to the existing ProcessDetail sourcetype.
We solved this conundrum by adding a new sourcetype, Process Statistics. This new sourcetype can be configured with a lower data collection frequency, reducing its impact on the (Splunk) backend data volume.
With the new Process Statistics sourcetype, customers have much more process data available for troubleshooting: handle count, private & virtual memory usage, priority, and page faults.
Protected Processes: EDR & Antivirus Performance Monitoring
Endpoint security products need to protect themselves from tampering and deactivation by malware. One of the techniques to help with such protection is built into the Windows OS: protected processes light (PPL). Unfortunately, the Windows security model does not allow regular user-mode monitoring products to query the CPU or RAM usage of a protected process. Consequently, we moved the collection of process performance data to a kernel-mode driver. This enables uberAgent 7.0 to collect performance metrics for all processes independent of their protection level. In other words: uberAgent is one of the few products that show how much CPU and memory your EDR or antivirus product is consuming.
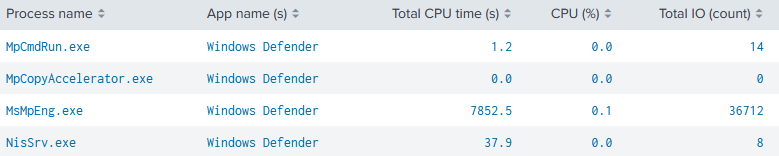
See this blog post for details on protected process monitoring.
Performance Counters: Dashboard & Wildcards
When you’re collecting performance counter data, you often don’t know all the instances that might be present on an endpoint. Physical disks are a prominent example: machines might have one, two, or even three disks. What if you want to collect information about each installed disk individually? You need wildcards!
uberAgent 7.0 not only supports wildcards with performance counters, it also comes with a cool new dashboard to analyze the collected performance counter data. The dashboard provides intuitive filtering and visualization options that make it possible, for example, to compare one host’s counter values with any other host’s as well as with the average of all hosts.
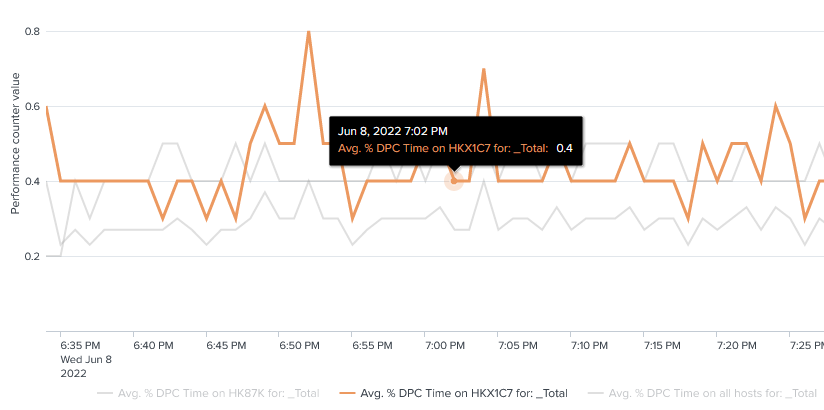
See this blog post for details on the performance counter monitoring improvements.
Intelligent Disk Buffering
The persistent output queue, introduced with uberAgent 6.2, is great in that it guarantees no events are lost. Isn’t it a little unfortunate, though, that it always writes new events to disk even if they could be sent off to the backend right away? In other words: why store new events on disk if network connectivity to the backend is available?
uberAgent 7.0 constantly monitors network connectivity to its backend. As long as the backend is reachable and processes new events correctly, the endpoint agent does not store events on disk but sends them to the backend directly, thus avoiding any disk IO on the endpoint. If the backend becomes unreachable, either because network connectivity is lost or because the backend has issues accepting data, the agent writes new events to the persistent output queue’s local database. uberAgent periodically checks if connectivity is back up. Once that is the case, it sends all events buffered to disk and reverts to the efficient direct sending.
See this blog post for details on intelligent disk buffering.
System Time Change Resilience
uberAgent measures the duration of many things that are happening on monitored endpoints, e.g., user logons and process starts. Have you ever wondered what happens if the system time changes when there is a time delta measurement in progress?
Short answer: bad things happen when the system time changes while you’re measuring the duration of a time interval.
Longer answer: the obvious but insufficient answer is to only use monotonic clocks (which are unaffected by system time changes) when measuring time deltas. The reason why it is insufficient is that sometimes you get absolute (wall-clock) timestamps from external sources, e.g., the OS. Such wall-clock timestamps are susceptible to system time changes.
We went through a lot of trouble to make uberAgent 7.0 resilient to system time changes. This is probably industry-first: we’re not aware of any other product that provides comparable metrics to uberAgent and is not affected by system time changes.
Hypervisor & Virtual Machine Detection
Many products try to detect whether they’re running in a VM or on physical hardware with the CPUID instruction built into Intel and AMD CPUs. uberAgent did the same in earlier versions. As it turned out, that is not enough. The most common issue with a VM detection approach that is solely based on the CPUID instruction is that Hyper-V parent partitions are detected as VMs, too.
Most IT pros want only the child partitions to be identified as VMs. The parent partition should be determined as physical. That is exactly what we implemented with uberAgent 7.0.
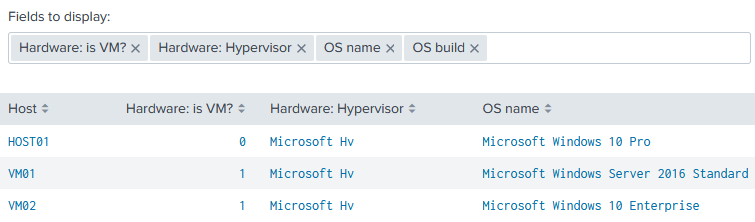
uberAgent 7.0 not only detects VMs as people expect it to but it also identifies a VM’s hypervisor type. Whether you’re running VMware, Hyper-V, KVM, QUEMU, VirtualBox, Xen, or others: all are identified correctly.
See this blog post for details on hypervisor & virtual machine detection.
uberAgent ESA
MITRE ATT&CK Technique ID Integration
uberAgent ESA Threat Detection rules now come with MITRE ATT&CK technique ID annotations. Based on those annotations, the uberAgent ESA Splunk dashboards have been enriched to show detailed descriptions and detection information for each detected technique.
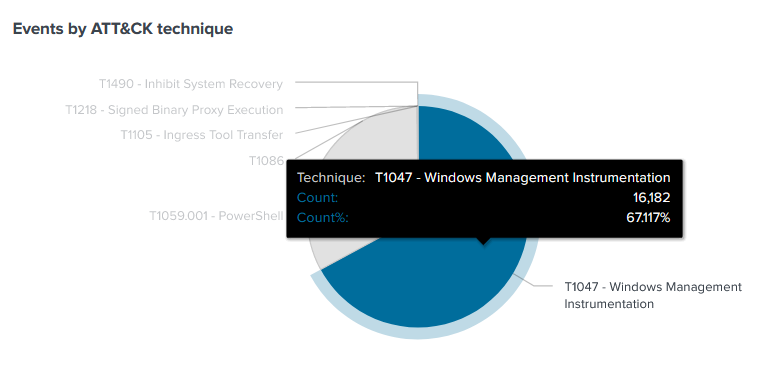
See this blog post for details on MITRE ATT&CK technique ID integration.
Splunk Enterprise Security Companion App
The new Splunk uberAgent ESA Enterprise Security companion app integrates uberAgent ESA metrics in Splunk’s Risk Based Alerting with support for event annotations (MITRE ATT&CK is the most prominent, but any others are supported, too).
In other words: once you have installed the uberAgent ESA Enterprise Security companion app, the Splunk Enterprise Security dashboard Risk Analysis is populated automatically with uberAgent data.
Even Better Splunk CIM Support
With uberAgent 7.0, we’ve further improved the support for Splunk’s Common Information Model (CIM). Wherever a matching CIM data model exists for an uberAgent sourcetype, the fields in uberAgent’s events are mapped to the corresponding fields in the CIM data model. This works out of the box; no manual configuration is required.
macOS
The macOS version of uberAgent’s endpoint agent has learned many new tricks, including:
- Improved application crash reporting with support for macOS 12 Monterey.
- Improved application identification.
- Detection of network connection failures.
- Correct handling of PID wrapping (process ID reuse by the OS).
Miscellaneous
uberAgent 7.0 comes with a ton of additional improvements and fixes, e.g.:
- The converted Sigma ruleset has been updated and now supports more categories.
- Authenticode signature verification has a new field:
IsSignedByOSVendor. - Support for Elasticsearch 8.
- Event triggers for timers to collect data when something happens, e.g., a user logs on.
- Nutanix Frame integration: uberAgent now collects metrics for Nutanix Frame sessions.
- Citrix Cloud monitoring improvements.
- New Experience Score dashboards visualize scores per machine, session, and application.
- New Splunk data model architecture.
About uberAgent
The uberAgent product family offers innovative digital employee experience monitoring and endpoint security analytics for Windows and macOS.
uberAgent UXM highlights include detailed information about boot and logon duration, application unresponsiveness detection, network reliability drill-downs, process startup duration, application usage metering, browser performance, web app metrics, and Citrix insights. All these varied aspects of system performance and reliability are smartly brought together in the Experience Score dashboard.
uberAgent ESA excels with a sophisticated Threat Detection Engine, endpoint security & compliance rating, the uAQL query language, detection of risky activity, DNS query monitoring, hash calculation, registry monitoring, and Authenticode signature verification. uberAgent ESA comes with Sysmon and Sigma rule converters, a graphical rule editor, and uses a simple yet powerful query language instead of XML.
About vast limits
vast limits GmbH is the company behind uberAgent, the innovative digital employee experience monitoring and endpoint security analytics product. vast limits’ customer list includes organizations from industries like finance, healthcare, professional services, and education, ranging from medium-sized businesses to global enterprises. vast limits’ network of qualified solution partners ensures best-in-class service and support anywhere in the world.


