uberAgent Explained: Machine Inventory, Timer Configuration
This is the first in a series of articles that highlight and explain specific aspects of uberAgent’s functionality.
uberAgent’s focus is on user experience. Our goal is to provide high-quality metrics that enable you to determine exactly what is going on: how many users are logged on, how long the logon takes, what happens during the logon, which applications are running, what slows them down, and much more. How does inventory data fit into all this?
Why Inventory?
In order to understand what is happening, you first need to know what you have. Machine inventory data provides a solid foundation to base decisions on and helps answer questions like these:
- Which hardware models do we have? How many of each?
- Which BIOS versions are out there? Do all machines have the same?
- Which operating systems are our clients and servers running?
- How many machines have a specific OS service pack?
- When was the operating system installed?
- How is the rollout of the new OS progressing?
Example
What does the machine inventory data collected by uberAgent look like? Here is a sample screenshot showing an excerpt from the corresponding dashboard:
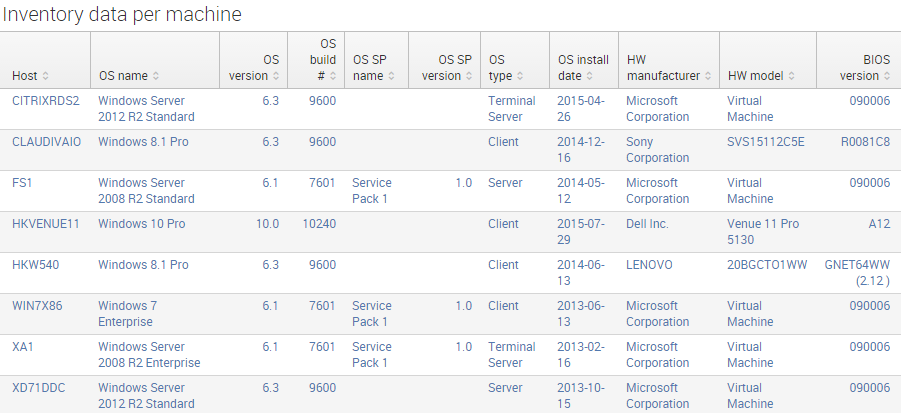
As you can see, uberAgent collects the following information for each machine:
- Computername (host)
- Operating system: name
- Operating system: version
- Operating system: build number
- Operating system: service pack name
- Operating system: service pack version
- Operating system: type
- Operating system: install date
- Hardware manufacturer
- Hardware model
- BIOS version
A full list of all metrics collected by uberAgent can be found here.
Configuration
Like its other metrics, uberAgent’s machine inventory collection can be configured flexibly. In order to configure metrics we first need to set up a timer.
Timers do nothing most of the time. They sleep. Occasionally, they wake up and collect the metrics associated with them. Then they go back to sleep. Nice life they have!
We can set up a new timer simply by adding a new timer section to the configuration:
[Timer]
Name              = Inventory
Comment           = Perform an inventory at a very low frequency
The comment is optional. A name is recommended to make it easier to identify the timer in the log file.
Next we need to specifiy how often we want the timer to wake up, i.e. the interval, aka data collection frequency:
Interval          = 86400000
Start delay       = 600000
Persist interval  = true
The interval is specified in milliseconds, thus the large number. 86400 seconds are equivalent to 24 hours, so we are collecting machine inventory data once per day. We also configured a start delay. This is optional, but useful for metrics like inventory, which we do not need right after the machine has booted. In this case, uberAgent waits 10 minutes after startup before it gathers the inventory information. Persist interval tells uberAgent to remember when it last collected data for the timer.
Finally, we associate metrics with the timer:
UA metric         = ApplicationInventory
UA metric         = SoftwareUpdateInventory
UA metric         = MachineInventory
Each timer can have an arbitrary number of metrics it collects data for.
Inventory data collection is not terribly important from a timing point of view. It does not matter whether it arrives a few milliseconds earlier or later. For that reason we assign this timer a low (background) priority:
Thread priority = background
That’s it. We configured a timer for inventory data collection. The full configuration looks like this:
[Timer]
Name              = Inventory
Comment           = Perform an inventory at a very low frequency
Interval          = 86400000
Start delay       = 600000
Persist interval  = true
Thread priority   = background
UA metric         = ApplicationInventory
UA metric         = SoftwareUpdateInventory
UA metric         = MachineInventory
If you like this configuration and want to apply it to your uberAgent configuration: no need to do that. What you see here is the default configuration uberAgent comes with right out of the box. Just install uberAgent and it will immediately start collecting all this great data.
About uberAgent
The uberAgent product family offers innovative digital employee experience monitoring and endpoint security analytics for Windows and macOS.
uberAgent UXM highlights include detailed information about boot and logon duration, application unresponsiveness detection, network reliability drill-downs, process startup duration, application usage metering, browser performance, web app metrics, and Citrix insights. All these varied aspects of system performance and reliability are smartly brought together in the Experience Score dashboard.
uberAgent ESA excels with a sophisticated Threat Detection Engine, endpoint security & compliance rating, the uAQL query language, detection of risky activity, DNS query monitoring, hash calculation, registry monitoring, and Authenticode signature verification. uberAgent ESA comes with Sysmon and Sigma rule converters, a graphical rule editor, and uses a simple yet powerful query language instead of XML.
About vast limits
vast limits GmbH is the company behind uberAgent, the innovative digital employee experience monitoring and endpoint security analytics product. vast limits’ customer list includes organizations from industries like finance, healthcare, professional services, and education, ranging from medium-sized businesses to global enterprises. vast limits’ network of qualified solution partners ensures best-in-class service and support anywhere in the world.


