uberAgent 7.1 Preview: DNS Exfiltration & Tunneling Detection
While we’re working on version 7.1 of our digital employee experience monitoring & endpoint security analytics products uberAgent UXM and uberAgent ESA, let’s take a look at a cool new feature: DNS exfiltration & tunneling detection.
TL;DR
uberAgent ESA 7.1 brings agent-based DNS risk calculation, and a new dashboard focused on the detection of malicious DNS activity.
Watch this concise video for a demonstration of exfiltration activity and how that lights up uberAgent’s detection dashboard.
What Are DNS Exfiltration and Tunneling?
DNS exfiltration techniques use the DNS protocol to funnel a data payload from a victim machine in a corporate network to an internet host controlled by the attacker. DNS tunneling, on the other hand, is a more generic term that not only applies to data exfiltration but also to command and control (C&C/C2).
DNS exfiltration and tunneling are very dangerous even though they’re not new. These types of attacks pose a serious risk because they abuse a core component of TCP/IP networks, the DNS protocol. DNS cannot be disabled, and even though the protocol’s privacy is being improved through encryption (DoT/DoH/DoQ), there doesn’t seem to be any way to block the data flow between across proxies and firewalls.
Please see this article for a more detailed description of DNS exfiltration and tunneling, including instructions for setting up a demo environment for experimentation purposes.
What’s New With uberAgent 7.1?
uberAgent ESA has had a DNS query monitoring feature since version 6.1. In the upcoming uberAgent 7.1, we’ve added two crucial elements to take the leap from monitoring to detection.
Splunk Dashboard Focused on Detection
The Process DNS Splunk dashboard from earlier uberAgent versions has been replaced by the new DNS Exfiltration & Tunneling dashboard. This new dashboard focuses exclusively on detection. It visualizes risky and potentially malicious DNS query activity in three distinct charts, each designed to highlight different aspects of DNS abuse.
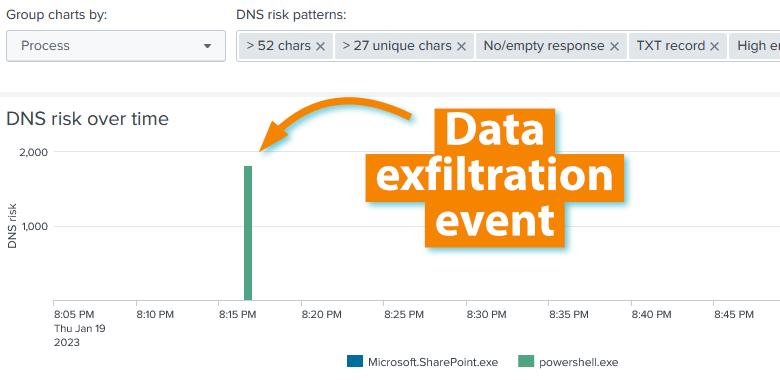
DNS Risk Over Time
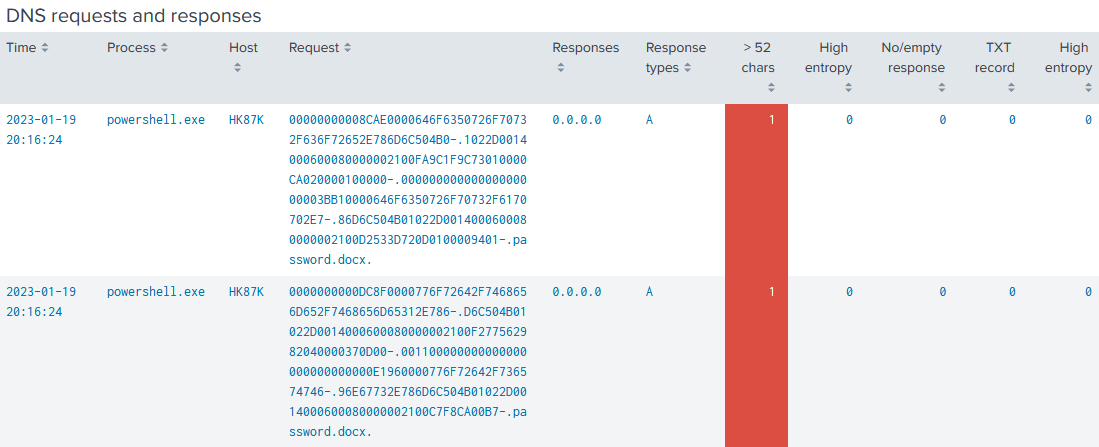
The chart DNS risk over time groups risky DNS queries by originating process over time. Normally, it should be empty. If it is not, uberAgent identified potentially malicious DNS requests. The chart shows you which processes that activity is coming from and how it fluctuates over time. Click any column in the chart for a table with details such as the requested DNS name, the DNS response, and why the request was flagged as risky by uberAgent:
Nslookup Abuse Over Time
Attackers may bypass the Windows DNS API by abusing nslookup.exe as a LOLBIN. Such activity is captured in the chart Nslookup abuse over time. By visualizing nslookup volume by host, this chart helps detect unnatural levels of nslookup activity, which may indicate malicious use. As with the chart above, a click on any column populates a table with details.
DNS Packet Size Distribution
The DNS packet size distribution chart provides a DNS request length histogram. In other words, it shows the number of DNS requests for each possible DNS packet size (1 through 250 bytes).
Most DNS requests are short; packet sizes between 10 and 35 bytes are the most common. To exfiltrate data, attackers either need big DNS packets or a tremendous amount of shorter queries. Both can be spotted in this histogram.
As with the charts above, clicking any column yields a table with details such as the requested DNS name and the DNS response.
Risk Categorization on the Endpoint
As uberAgent inspects DNS query activity on the endpoint, it calculates the risk associated with each query and assigns risk flags in various categories, including:
- Entropy
- Number of unique characters
- Request size
- Unusual record types
As explained above, the resulting risk data is visualized in the Splunk dashboard.
Implementation on the Endpoint vs. in the Backend
The risk calculation could be implemented in the Splunk backend, too, but that would generate a considerable load. By moving the risk calculation to the endpoint, we minimized the strain placed on the SIEM infrastructure. The move to the endpoint has an additional benefit: it ensures that the risk data is available in all supported backends, not only in Splunk.
About uberAgent
The uberAgent product family offers innovative digital employee experience monitoring and endpoint security analytics for Windows and macOS.
uberAgent UXM highlights include detailed information about boot and logon duration, application unresponsiveness detection, network reliability drill-downs, process startup duration, application usage metering, browser performance, web app metrics, and Citrix insights. All these varied aspects of system performance and reliability are smartly brought together in the Experience Score dashboard.
uberAgent ESA excels with a sophisticated Threat Detection Engine, endpoint security & compliance rating, the uAQL query language, detection of risky activity, DNS query monitoring, hash calculation, registry monitoring, and Authenticode signature verification. uberAgent ESA comes with Sysmon and Sigma rule converters, a graphical rule editor, and uses a simple yet powerful query language instead of XML.
About vast limits
vast limits GmbH is the company behind uberAgent, the innovative digital employee experience monitoring and endpoint security analytics product. vast limits’ customer list includes organizations from industries like finance, healthcare, professional services, and education, ranging from medium-sized businesses to global enterprises. vast limits’ network of qualified solution partners ensures best-in-class service and support anywhere in the world.


