uberAgent 3.7: SMB Performance, Splunk 6.5, Windows Server 2016
We are happy to announce the newest version of our user experience and application performance monitoring product. uberAgent 3.7 adds full support for brand new Splunk 6.5 and Windows Server 2016. Of course, it works happily on Windows 10 version 1607 (anniversary update), too, as well as any relevant older version of Windows.
uberAgent 3.7 monitors SMB performance, tracks application crashes and displays boot activity per process (more information below). We also added the ability to send the collected data directly to Splunk’s HTTP Event Collector without involving Splunk’s Universal Forwarder (which can optionally still be used).
For a full list of all improvements and bugfixes please consult the change log. As always, upgrading is highly recommended.
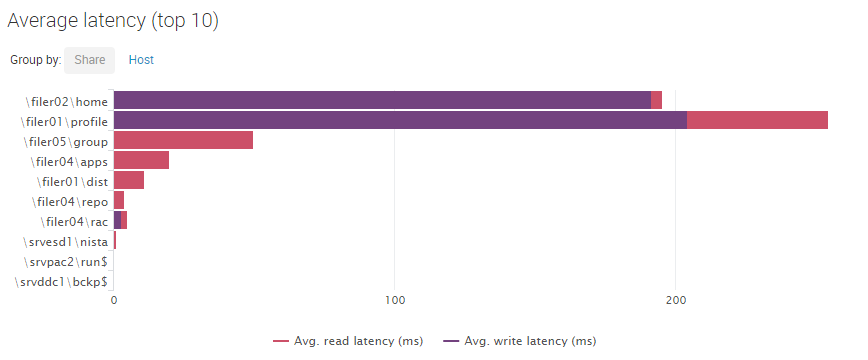
SMB IOPS and Latency per Network File Share
In enterprise end-user computing SMB is one of the most important protocols. Whenever you map a drive or access a UNC path, SMB is being used to connect to a file share. Home and group directories are accessed over SMB. Folder redirection, a popular technology for reducing the size of the user profile, relies on SMB.
Not surprisingly, SMB performance is critical for user experience. As Aaron Parker, Shawn Bass, and Helge Klein have shown in a series of conference talks and blog posts bad SMB performance severely impacts end-user experience and breaks applications.
Have you ever seen “inexplicable” hangs where an application’s UI became unresponsive for seconds or even minutes on end? The root cause could very well have been an overloaded file server experiencing the occasional CPU spike. But how to prove that?
uberAgent 3.7 has just what you need. For every SMB connection, it measures how long it takes for reads and writes to complete (latency), how many read and write requests are issued per second (IOPS), and how much data is transferred. Armed with that knowledge it is easy to determine when and where folder redirection caused application hangs. Even hours and days after the fact.
Application Crashes and Hangs
Whenever applications crash or hang, end users lose time and the business loses money. Not every single crash can be analyzed, so IT needs to be able to find out if specific machines are affected more than others. Or is it happening in certain branch offices only? What about application versions – maybe that new patch has side effects? And finally, the user: it is not at all unheard of that some users are plagued with crashes while others are not.
uberAgent’s high-definition metrics help you answer all of the above questions. And the advanced statistical capabilities of the underlying Splunk platform make analyzing correlations a breeze.
Process Activity During Machine Boot
The duration of a PC’s full system boot depends mainly on two factors: the number of processes started during the boot phase and the disk IO generated per process. Reducing the boot duration requires in-depth knowledge of what is running and how expensive it is in terms of performance. uberAgent helps with that.
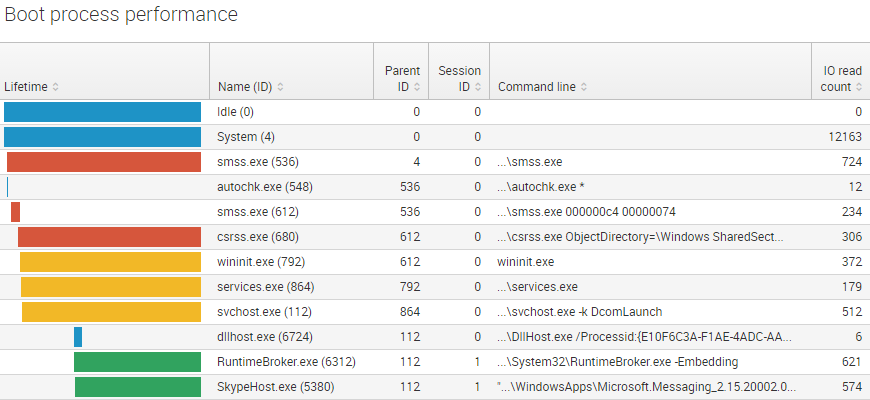
uberAgent now displays all processes that were active during a Windows boot along with their respective lifetime, command line, and disk IO count and volume, to name just a few. One glance at the Single Boot dashboard tells you exactly how much each application or service impacts boot performance.
About uberAgent
The uberAgent product family offers innovative digital employee experience monitoring and endpoint security analytics for Windows and macOS.
uberAgent UXM highlights include detailed information about boot and logon duration, application unresponsiveness detection, network reliability drill-downs, process startup duration, application usage metering, browser performance, web app metrics, and Citrix insights. All these varied aspects of system performance and reliability are smartly brought together in the Experience Score dashboard.
uberAgent ESA excels with a sophisticated Threat Detection Engine, endpoint security & compliance rating, the uAQL query language, detection of risky activity, DNS query monitoring, hash calculation, registry monitoring, and Authenticode signature verification. uberAgent ESA comes with Sysmon and Sigma rule converters, a graphical rule editor, and uses a simple yet powerful query language instead of XML.
About vast limits
vast limits GmbH is the company behind uberAgent, the innovative digital employee experience monitoring and endpoint security analytics product. vast limits’ customer list includes organizations from industries like finance, healthcare, professional services, and education, ranging from medium-sized businesses to global enterprises. vast limits’ network of qualified solution partners ensures best-in-class service and support anywhere in the world.


