Top 10 Issues uberAgent Helps Identify in Minutes
The wealth of data collected by uberAgent may initially be a little bit overwhelming. There are so many useful metrics that the hardest decision may be which one is the most useful. This post should help. We picked the top 10 issues we see in the field and we show how to pinpoint each one of them in minutes with uberAgent.
Slow Logon Because of Delays in the Logon Script
Problem
Logon scripts are great if they are well-written. They can be a major pain if not! The top stumbling blocks I saw in my former consultant job were drive mappings, copy jobs and sleep commands. I am sure you could add a few more to the list.
How uberAgent Helps
uberAgent detects and lists every process that runs during any user logon. uberAgent shows when and for how long a process ran, the process’ parent and its command line. Just the information you need to troubleshoot delays in logon scripts.
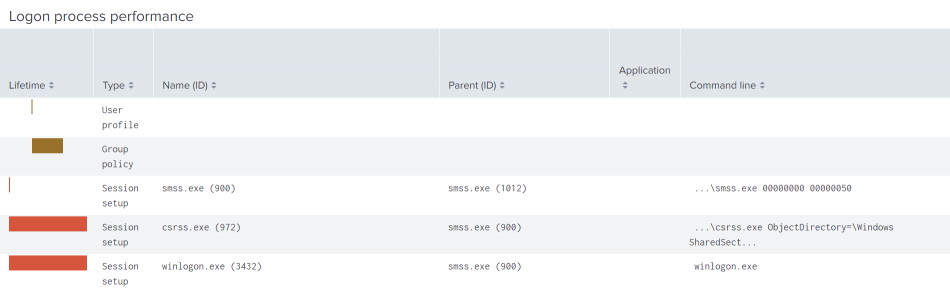
Helpful dashboards: User Logon Duration, Single Logon
Slow Logon Because of GPP Drive Mapping Issues
Problem
Group Policy Preferences (GPP) makes mapping network drives comfortable by presenting a nice user interface, instead of having to fumble with logon scripts. However, if target servers are unavailable, logons become slow. The typical delay is 5-7 seconds – per mapping. Trying to map three drives to servers that are not available may easily cost your users 20 seconds. Every single time they log on or start a published application. This happens way more often than one should think it does.
How uberAgent Helps
uberAgent shows the duration for every CSE (client-side extension) that is running during a logon, including the one responsible for drive mappings configured with GPP. If you see very high numbers here, there is most likely a problem with the target server.
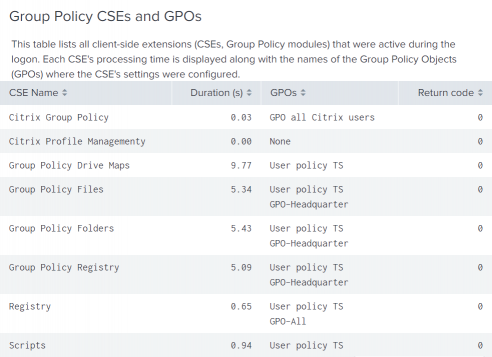
Helpful dashboards: User Logon Duration, Single Logon
Outlook Occasionally Slow Because of an Overloaded Backend
Problem
As a client/server application, Outlook constantly communicates with its backend Exchange servers. If an Exchange server is overloaded and cannot respond in a timely manner, Outlook has to wait. For the end user, it appears as if Outlook was slow where in reality the backend is causing the delays.
How uberAgent Helps
The time it takes Outlook to send data to its backend server and getting the answer is called network latency. uberAgent’s application network communication metrics include the latency for every target. If the latency to one target is high, that target is overloaded or has other kinds of problems.
Helpful dashboards: Application Network Communication
Application Errors Because of a Missing Firewall Activation
Problem
Missing firewall activations are a favorite topic, especially in large companies. When an application does not work and you are calling the firewall guys you will often get “the port should be open” as a response. It never is!
How uberAgent Helps
uberAgent shows application network issues including failed connects for every target and port. Now you can prove that the port is not open!
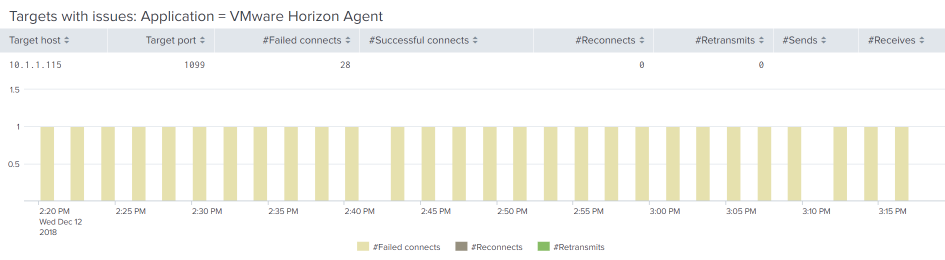
Helpful dashboards: Application Network Issues
Slow Boot Because of too Many Services and Agents
Problem
We know uberAgent is not the only agent on your systems. You might already have a backup agent, a software deployment agent, an anti-virus agent and so on. That is why we come with a small footprint! The more agents and services you have, the more is written to and read from the storage during daily work but especially during boots. That means a lot of storage IO which results in slow boots.
How uberAgent Helps
uberAgent collects detailed IO information for every process running during any machine boot. It even shows which drivers and services cause delays. This functionality makes it possible to identify agents and other software components that cause delays at a glance.
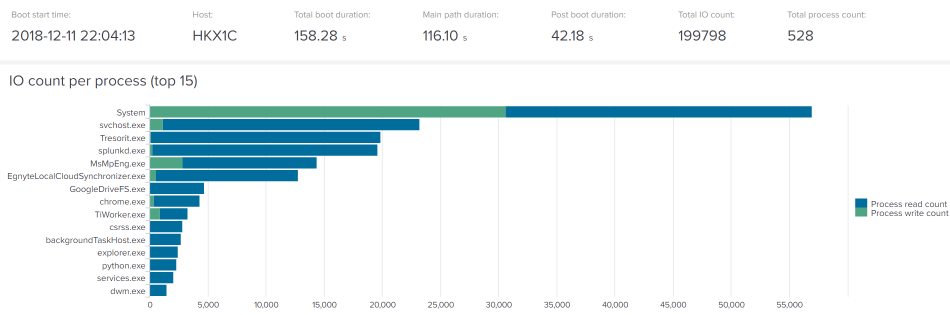
Helpful dashboards: Boot Duration, Boot Delays
High Citrix Site Load Because of an Incorrect Sizing
Problem
You can find tons of articles out there on how to properly size Citrix environments. Even experienced engineers often fail in this space. Without proper sizing, you are likely to spend more money than necessary and spend part of it on things you do not need instead of investing it where it really improves performance.
How uberAgent Helps
uberAgent has a dashboard solely for sizing Citrix sites which shows the average load for CPU, RAM, disk, and network. Based on these numbers you can identify the bottleneck in your Citrix site and invest money where it really improves performance.
Helpful dashboards: SBC Sizing and Capacity Planning
Which Applications are Actually Being Used?
Problem
You know exactly which applications are installed on your endpoints, right? Of course, you (should) have a software deployment tool which shows that. But do you also know which of them are actually being used? It is not unlikely that your organization is maintaining dozens or even hundreds of applications that no one ever runs.
How uberAgent Helps
With uberAgent’s application usage metering you are able to answer annoying questions like these:
- We need to test our applications prior to the migration to a new OS. For starters, how many different applications do we have?
- We have got 140 licenses for product Z. Is that enough?
- We are ordering new servers for application A. We need 1 CPU core per user – how many cores do we need in total?
In other words, application usage metering helps with resource planning, license compliance and sizing.
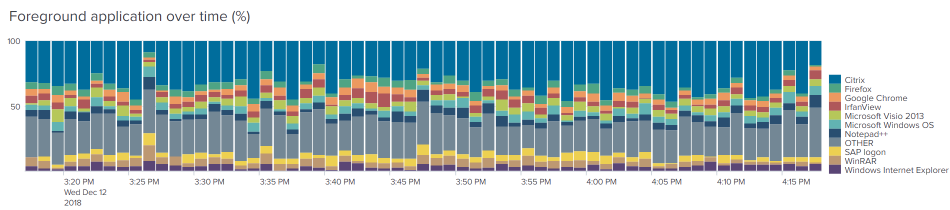
By the way, uberAgent also has an application inventory functionality.
Helpful dashboards: Application Usage
Which Web and SaaS Apps are Actually Being Used?
Problem
Now that you know which applications are really being run by your users (see point 7), do you also know to which percentage they are working in the browser and with which apps? These days, web apps have nearly the same capabilities as native Windows applications, hence they should be monitored in the same way.
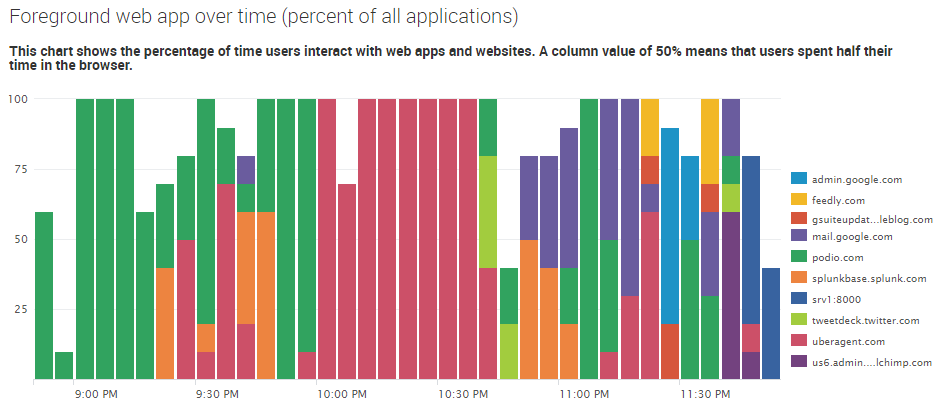
How uberAgent Helps
With the help of browser extensions, uberAgent shows which web apps are used how often, for how long, and how slow (or fast) the web pages are loading.
Helpful dashboards: Browser Web App Performance, Browser Web App Usage
Which Citrix Workspace Client Versions Do You Have?
Problem
Citrix releases new versions of Workspace client (formerly Citrix Receiver) faster than new versions of Virtual Apps and Desktops (formerly XenApp & XenDesktop). It is quite likely that you have different ICA/HDX client versions in the field which makes troubleshooting unnecessarily difficult.
How uberAgent Helps
uberAgent shows the client version for every remoting session. This makes troubleshooting a lot easier. By the way, this works for VMware Horizon and Microsoft RDP, too, of course,
Helpful dashboards: Session Info: Citrix, Session Info: VMware
Application Crashes at a Specific Version or for a Certain User
Problem
Some users are complaining that your line of business application crashes from time to time. For other users, the application runs fine. These are everybody’s most “loved” helpdesk tickets. Good luck calling all your 20,000 users asking which version they are using right now.
How uberAgent Helps
uberAgent provides important information about application hangs and crashes that is not available in the Windows event log. For every hang or crash, uberAgent not only records the process name, faulting module, and exception code, but also the application version, the username and the process lifetime.
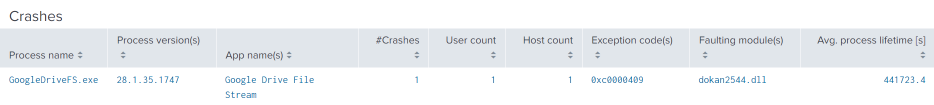
Helpful dashboards: Application Errors
This concludes our list. Do you have other stories how uberAgent helped you? We would be happy to hear about them in the comments!
About uberAgent
The uberAgent product family offers innovative digital employee experience monitoring and endpoint security analytics for Windows and macOS.
uberAgent UXM highlights include detailed information about boot and logon duration, application unresponsiveness detection, network reliability drill-downs, process startup duration, application usage metering, browser performance, web app metrics, and Citrix insights. All these varied aspects of system performance and reliability are smartly brought together in the Experience Score dashboard.
uberAgent ESA excels with a sophisticated Threat Detection Engine, endpoint security & compliance rating, the uAQL query language, detection of risky activity, DNS query monitoring, hash calculation, registry monitoring, and Authenticode signature verification. uberAgent ESA comes with Sysmon and Sigma rule converters, a graphical rule editor, and uses a simple yet powerful query language instead of XML.
About vast limits
vast limits GmbH is the company behind uberAgent, the innovative digital employee experience monitoring and endpoint security analytics product. vast limits’ customer list includes organizations from industries like finance, healthcare, professional services, and education, ranging from medium-sized businesses to global enterprises. vast limits’ network of qualified solution partners ensures best-in-class service and support anywhere in the world.


