Now you can PROVE that it’s not Citrix but the backend!
You have been there: end-users are complaining and your boss demands an explanation why “Citrix is slow” – again. You, the XenApp/XenDesktop admin, desperately look at Task Manager and Perfmon, but you cannot find a thing. Your servers are humming along quite nicely, but still: applications are slow, the system feels sluggish and logons are taking forever. And then, all of a sudden, things are back to normal. What was going on? How do you prevent that from happening again?
The reason for these mystery events very often lies with a backend service experiencing problems or hitting a bottleneck. If, for example, the file server is under high load, its response times are going to increase and your users will notice. Now all you need is a tool to prove that!
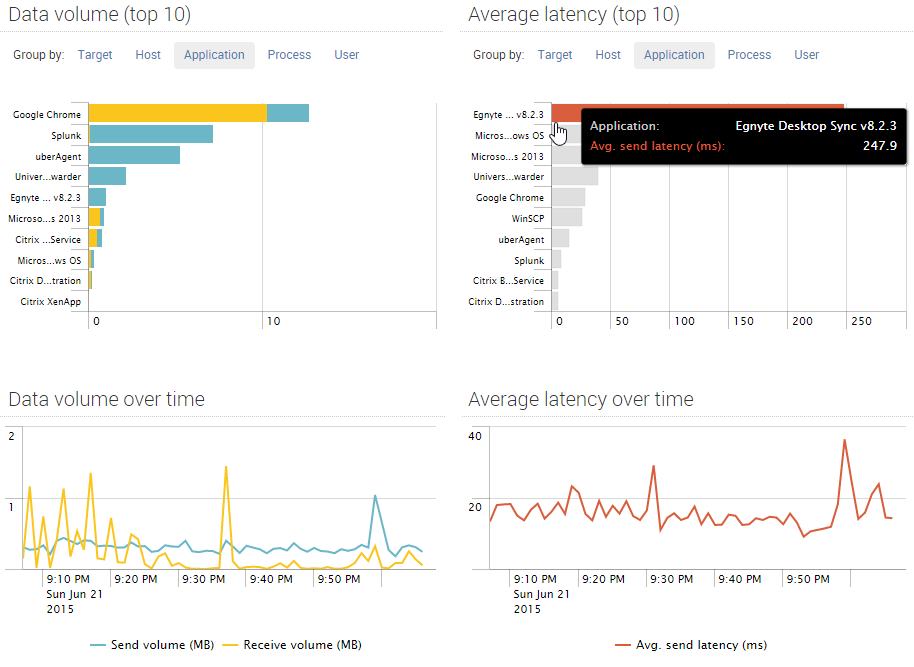
uberAgent reports on network performance – individually per application and per communication target. It shows you the data volume transferred and, much more importantly, the latency of each connection. Looking at the latency over time it is trivial to spot whether a particular service is currently performing subpar or not:
About uberAgent
The uberAgent product family offers innovative digital employee experience monitoring and endpoint security analytics for Windows and macOS.
uberAgent UXM highlights include detailed information about boot and logon duration, application unresponsiveness detection, network reliability drill-downs, process startup duration, application usage metering, browser performance, web app metrics, and Citrix insights. All these varied aspects of system performance and reliability are smartly brought together in the Experience Score dashboard.
uberAgent ESA excels with a sophisticated Threat Detection Engine, endpoint security & compliance rating, the uAQL query language, detection of risky activity, DNS query monitoring, hash calculation, registry monitoring, and Authenticode signature verification. uberAgent ESA comes with Sysmon and Sigma rule converters, a graphical rule editor, and uses a simple yet powerful query language instead of XML.
About vast limits
vast limits GmbH is the company behind uberAgent, the innovative digital employee experience monitoring and endpoint security analytics product. vast limits’ customer list includes organizations from industries like finance, healthcare, professional services, and education, ranging from medium-sized businesses to global enterprises. vast limits’ network of qualified solution partners ensures best-in-class service and support anywhere in the world.


