Monitoring Browser Performance per Site
The days are long gone when a browser was just another application. Modern websites are applications of their own, and the browser is their operating system. That has consequences for monitoring. It is no longer sufficient to gather performance data for the browser as a whole. When, for example, Internet Explorer’s CPU usage is high, Administrators need to understand what caused that. Is it the business-critical ERP site or are people just watching funny videos on YouTube?
From Application to OS
Browsers started as simple programs, capable of displaying text and the odd image. Back in those days, the browser was an application that displayed static pages with no logic of their own. That changed dramatically with Ajax and Web 2.0. Boring HTML documents were pimped with JavaScript and the web slowly morphed from a collection of pages to a collection of applications.
All these millions of applications run on a single operating system – the browser. It had to evolve a lot to keep pace with the web’s rapid progress. Its JavaScript interpreter was soon complemented with a just-in-time compiler, it learned to run games smoothly and today even plays HD video without implants (plugins).
Browsers have become operating systems of their own. Some even have their own task manager.
Monitoring the Websites’ OS
When monitoring an operating system you want more than just one metric for the operating system as a whole. You want to know the resource usage of each application individually.
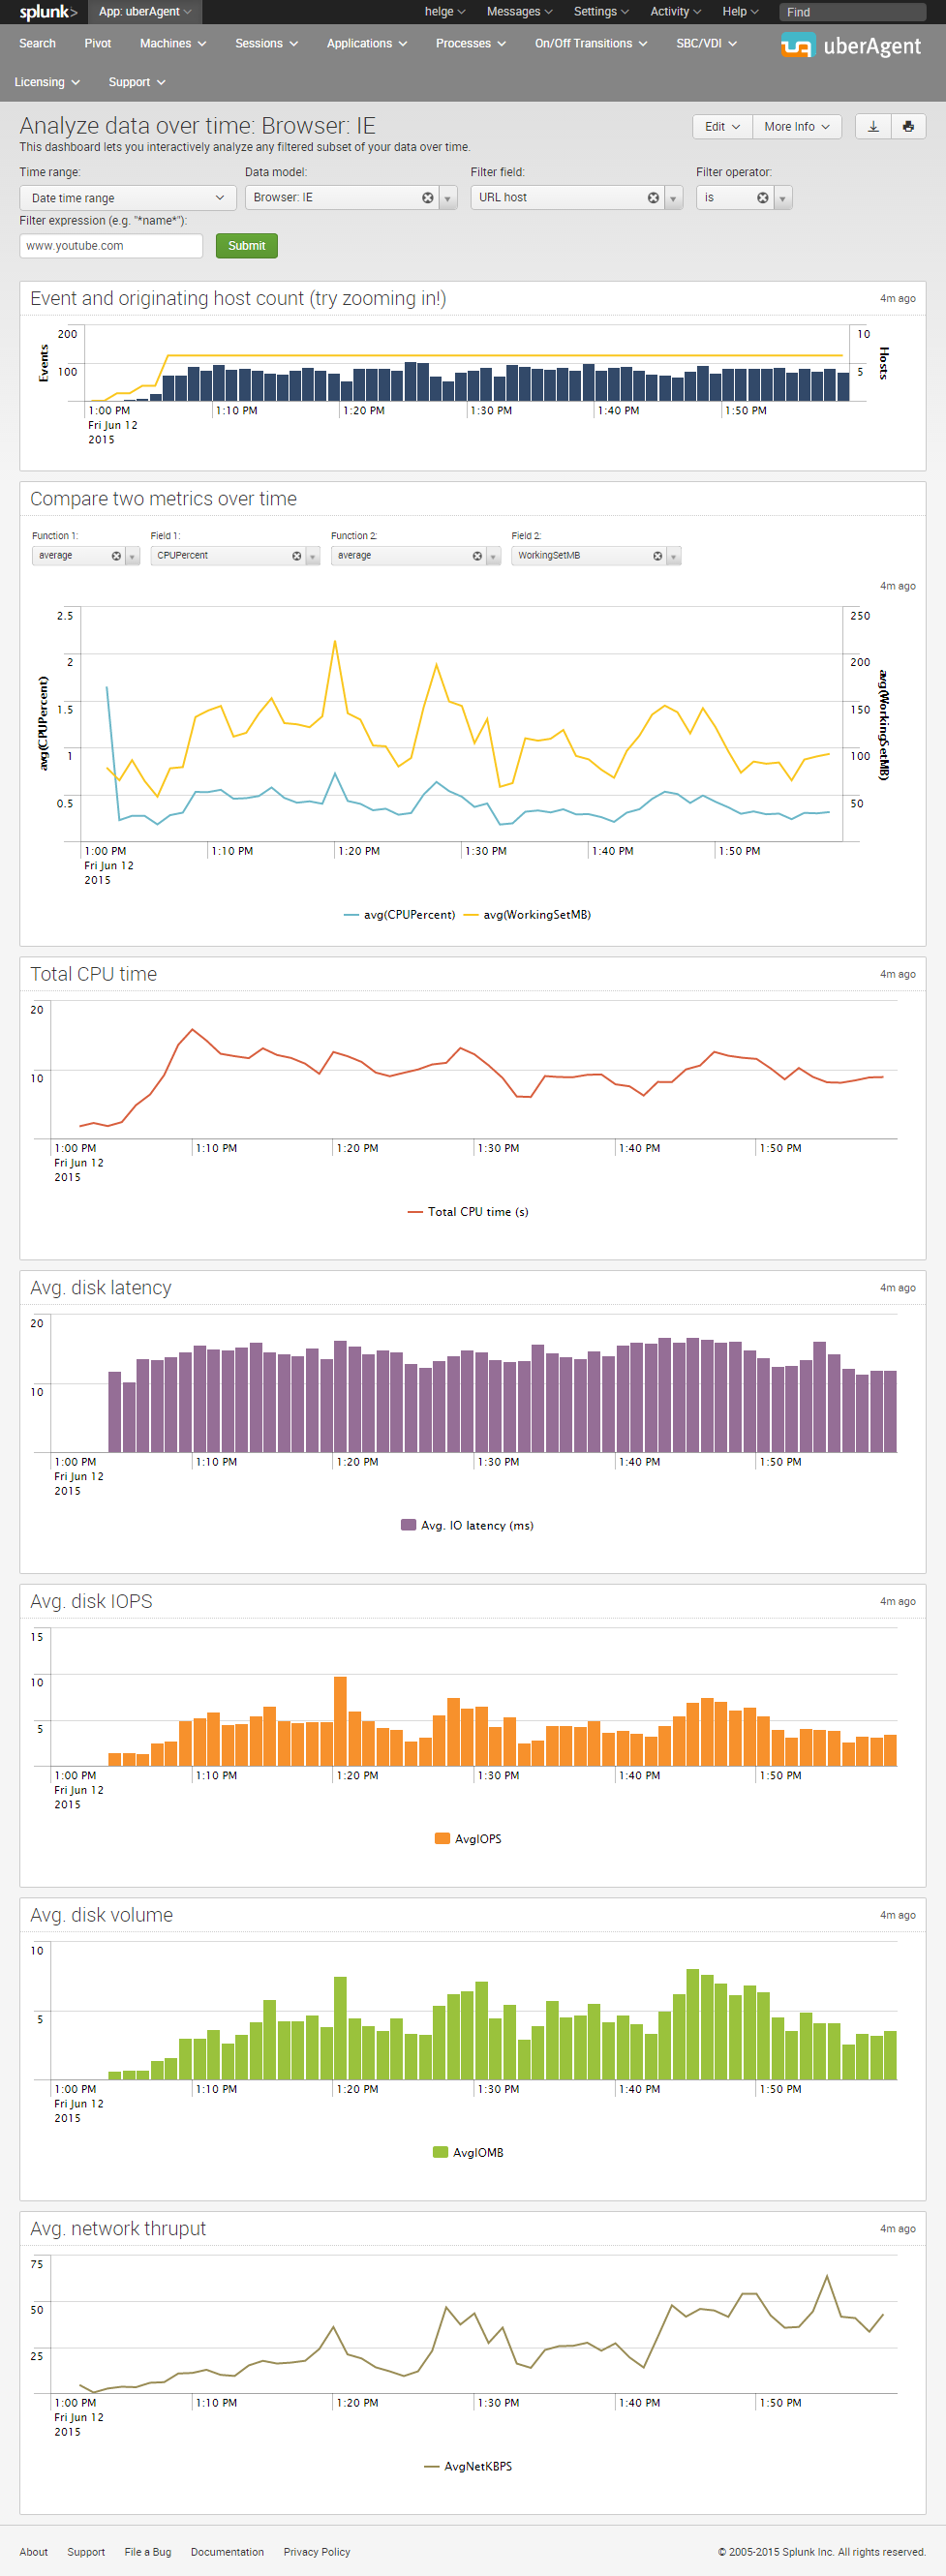
If websites are applications you need a way to monitor the performance characteristics of each site – how many IOPS it generates, how much RAM it uses, how it loads the CPU. Now you can.
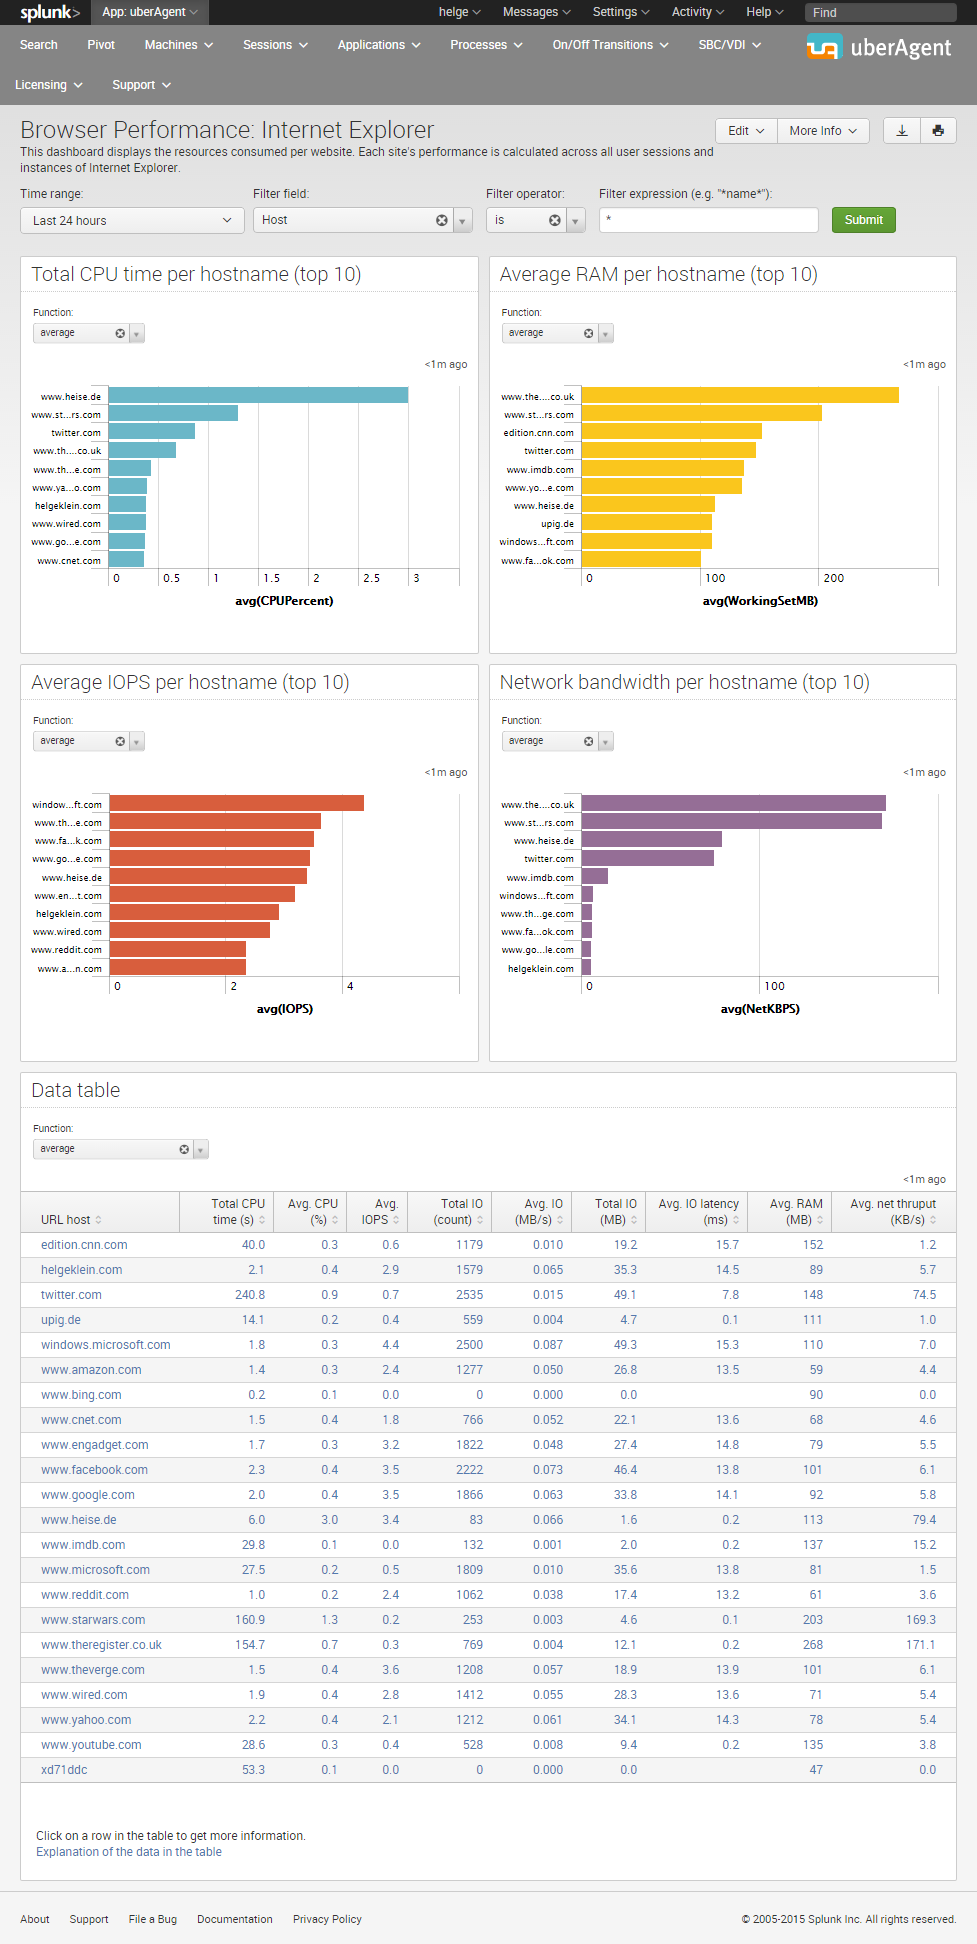
uberAgent gives you detailed performance data for every website and any time period:
And it helps identify the bad guys that eat up the CPU cycles and steal the RAM:
About uberAgent
The uberAgent product family offers innovative digital employee experience monitoring and endpoint security analytics for Windows and macOS.
uberAgent UXM highlights include detailed information about boot and logon duration, application unresponsiveness detection, network reliability drill-downs, process startup duration, application usage metering, browser performance, web app metrics, and Citrix insights. All these varied aspects of system performance and reliability are smartly brought together in the Experience Score dashboard.
uberAgent ESA excels with a sophisticated Threat Detection Engine, endpoint security & compliance rating, the uAQL query language, detection of risky activity, DNS query monitoring, hash calculation, registry monitoring, and Authenticode signature verification. uberAgent ESA comes with Sysmon and Sigma rule converters, a graphical rule editor, and uses a simple yet powerful query language instead of XML.
About vast limits
vast limits GmbH is the company behind uberAgent, the innovative digital employee experience monitoring and endpoint security analytics product. vast limits’ customer list includes organizations from industries like finance, healthcare, professional services, and education, ranging from medium-sized businesses to global enterprises. vast limits’ network of qualified solution partners ensures best-in-class service and support anywhere in the world.


