Listing Users Who Are Launching Applications Often
One of our customers wanted to identify users who launch a specific executable more often than n times in a given time range. That is easy to accomplish, given that uberAgent monitors process starts. This article describes multiple ways to query for that information.
The following walkthroughs illustrate how to identify processes by executable or by application name, counting process/application launches per user for any time range. We will start with a “traditional” Splunk SPL search, followed by a second implementation that makes use of the uberAgent data model.
Splunk SPL Search
Let’s build the Splunk SPL search step by step.
Step 1
We start with all events from uberAgent’s index.
Note: to facilitate changing the index name used by uberAgent, all our dashboards make use of the uberAgent_index macro which contains the actual index name. The macro is defined in macros.conf of the uberAgent searchhead app.
index=`uberAgent_index`
Step 2
We filter for the process startup sourcetype which contains one event per started process.
Note: The documentation of uberAgent’s sourcetypes and fields can be found here.
index=`uberAgent_index` sourcetype=uberAgent:Process:ProcessStartup
Step 3
We ignore processes started by SYSTEM, LOCAL SERVICE and NETWORK SERVICE.
Note: The pseudo-users sys, lvc and nvc are defined in the lookup table systemusers.csv of the uberAgent searchhead app. They are auto-expanded to the proper user names SYSTEM, LOCAL SERVICE and NETWORK SERVICE in uberAgent’s data model.
index=`uberAgent_index` sourcetype=uberAgent:Process:ProcessStartup ProcUser!=sys ProcUser!=lvc ProcUser!=nvc
Step 4
We add a filter for the name of the process we are interested in, Winword.exe in this example.
index=`uberAgent_index` sourcetype=uberAgent:Process:ProcessStartup ProcUser!=sys ProcUser!=lvc ProcUser!=nvc ProcName=Winword.exe
Step 5
We count the number of (start) events per user.
Note: The only purpose of adding the field ProcName to the stats command is to make it part of the results table, too.
index=`uberAgent_index` sourcetype=uberAgent:Process:ProcessStartup ProcUser!=sys ProcUser!=lvc ProcUser!=nvc ProcName=Winword.exe
| stats count as Starts by ProcName ProcUser
Step 6
We only keep users with more than five starts in the results list.
index=`uberAgent_index` sourcetype=uberAgent:Process:ProcessStartup ProcUser!=sys ProcUser!=lvc ProcUser!=nvc ProcName=Winword.exe
| stats count as Starts by ProcName ProcUser
| where Starts > 5
Step 7
We rename fields to make them look nicer.
index=`uberAgent_index` sourcetype=uberAgent:Process:ProcessStartup ProcUser!=sys ProcUser!=lvc ProcUser!=nvc ProcName=Winword.exe
| stats count as Starts by ProcName ProcUser
| where Starts > 5
| rename ProcUser as User ProcName as Process
Step 8
We sort the results so that the user with the highest number of starts is listed first. The 0 in the sort command ensures that the output is not truncated after the 10,000th result.
index=`uberAgent_index` sourcetype=uberAgent:Process:ProcessStartup ProcUser!=sys ProcUser!=lvc ProcUser!=nvc ProcName=Winword.exe
| stats count as Starts by ProcName ProcUser
| where Starts > 5
| rename ProcUser as User ProcName as Process
| sort 0 -Starts
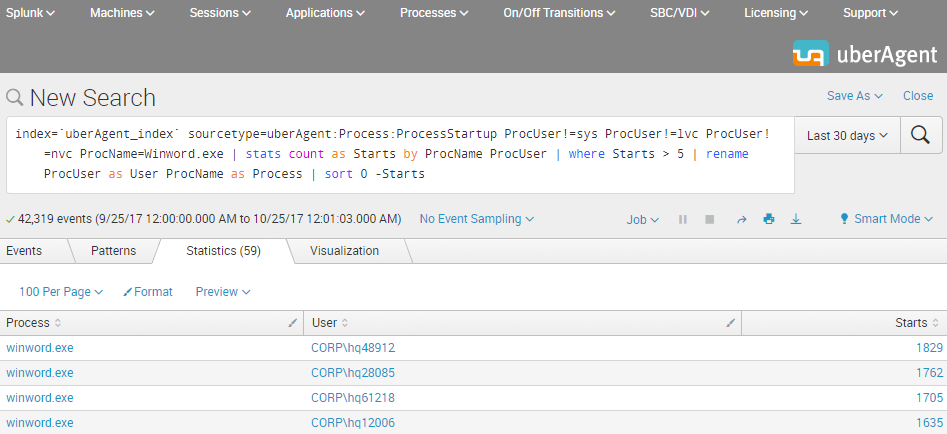
The Result
This is what the final Splunk SPL search for users with more than five starts of Winword.exe looks like. The screenshot below shows the search being run over the past 30 days. In practice, you would adjust the time range to any relevant time interval.
Accelerated Data Model Search
uberAgent comes with an accelerated data model. Searching an accelerated data model is a lot faster than searching the underlying index (by “a lot” we mean at least 50x), but requires a different search syntax based on the pivot or tstats commands. We are using pivot because of the easier syntax compared to tstats.
In this second example, we demonstrate how to search for starts of a “modern” UWP app, specifically the weather app that is part of Windows. Most UWP apps cannot be identified by process name – which is simply backgroundTaskHost.exe. Luckily uberAgent determines the real app name automatically.
Step 1
We start with a count of all process starts.
Note: The documentation for the Splunk pivot command can be found here.
| pivot uberAgent Process_ProcessStartup count(Process_ProcessStartup) as Starts
Step 2
We filter for the weather app.
Note: An easy way to identify the name of the weather app is to dig around with a search like the following: index=`uberAgent_index` sourcetype=uberAgent:Process:ProcessStartup AppName=*Weather*
| pivot uberAgent Process_ProcessStartup count(Process_ProcessStartup) as Starts
   filter AppName is "Microsoft.BingWeather"
Step 3
We split by user so that we get a count of process starts per user (renaming the ProcUser field to User in the process).
| pivot uberAgent Process_ProcessStartup count(Process_ProcessStartup) as Starts
   filter AppName is "Microsoft.BingWeather"
   splitrow ProcUser as User
Step 4
We only keep users with more than five starts in the results list. We also sort the results so that the user with the highest number of starts is listed first. The 0 in the sort command ensures that the output is not truncated after the 10,000th result.
| pivot uberAgent Process_ProcessStartup count(Process_ProcessStartup) as Starts
   filter AppName is "Microsoft.BingWeather"
   splitrow ProcUser as User
| where Starts > 5
| sort 0 -Starts
Step 5
We add the application name as a row to the results table.
| pivot uberAgent Process_ProcessStartup count(Process_ProcessStartup) as Starts latest(AppName) as Application
   filter AppName is "Microsoft.BingWeather"
   splitrow ProcUser as User
| where Starts > 5
| sort 0 -Starts
| table Application User Starts
The Result
The resulting output is very similar to the first example above: a table with the application, the users and the number of starts that can easily be exported to CSV or otherwise be processed further.
About uberAgent
The uberAgent product family offers innovative digital employee experience monitoring and endpoint security analytics for Windows and macOS.
uberAgent UXM highlights include detailed information about boot and logon duration, application unresponsiveness detection, network reliability drill-downs, process startup duration, application usage metering, browser performance, web app metrics, and Citrix insights. All these varied aspects of system performance and reliability are smartly brought together in the Experience Score dashboard.
uberAgent ESA excels with a sophisticated Threat Detection Engine, endpoint security & compliance rating, the uAQL query language, detection of risky activity, DNS query monitoring, hash calculation, registry monitoring, and Authenticode signature verification. uberAgent ESA comes with Sysmon and Sigma rule converters, a graphical rule editor, and uses a simple yet powerful query language instead of XML.
About vast limits
vast limits GmbH is the company behind uberAgent, the innovative digital employee experience monitoring and endpoint security analytics product. vast limits’ customer list includes organizations from industries like finance, healthcare, professional services, and education, ranging from medium-sized businesses to global enterprises. vast limits’ network of qualified solution partners ensures best-in-class service and support anywhere in the world.


