Creating a Foreground Application Usage Report
Would you like to find out which applications your users spend most of their time with? Which application versions are being run? How long ago applications were last used? You have come to the right place.
Application Inventory, Usage – and the Foreground App
Of the hundreds of applications that may be installed on a machine, only a few dozen are typically running concurrently. Of those applications that are running there is always one that has a special role: it receives the keyboard input. That is the active foreground application. That is the application the user is currently interacting with.
uberAgent determines application inventory and usage on several different levels. It regularly runs an inventory scan, identifying all applications that are installed. uberAgent also monitors all running applications, for which it collects detailed information, e.g., the version number. Last, but not least, uberAgent reports which application currently is the foreground app.
In this post, we are going to make use of the latter two information sets to create a report that lists all running applications along with their versions, when they were last seen and how often each application was the foreground app.
uberAgent’s Pre-Built Dashboards
Before we dive into custom searches let’s take a look at what uberAgent’s dashboards have to offer. The Application Usage dashboard, for example, shows which applications I used most recently:
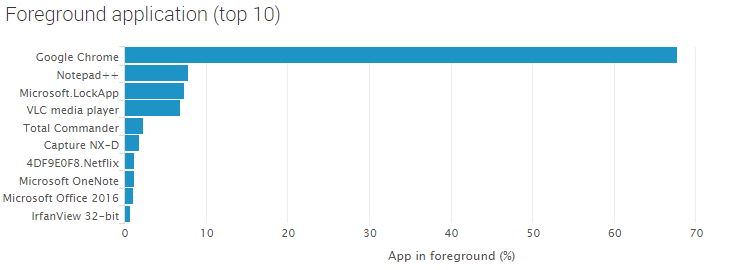
It seems I am spending a lot of time – more than two thirds – in the browser. When I don’t, I am using an editor, keeping the screen locked, playing video or organizing files, to name the most relevant applications for yours truly.
The above is only a fraction of what is available out of the box, of course. uberAgent’s dashboards let you dive right in to figure out how applications are used over time, which application versions are used by how many people, and much more.
A Custom Application Usage Report
Requirements
This blog post was inspired by a customer who asked how to create an application usage report that also showed for each app whether it was being run in the foreground. We have tweaked those requirements slightly and are going to present a Splunk search that generates a report with the following fields:
- Application name
- Application version(s)
- Application last run date
- Application in foreground (%)
The Splunk Search
uberAgent collects detailed information on all running applications every 30 seconds in the ProcessDetail sourcetype. The currently active foreground application, however, is determined per user session in the sourcetype SessionDetail.
Translated to the accelerated data model which we typically use for searches due to the vastly superior performance, that corresponds to the datasets Process_ProcessDetail and Session_SessionDetail_Users.
The search we are going to build consists of three parts:
- For each running application, get us the name, version(s) and last run time
- For each of the resulting applications, determine how often they were in the foreground
- Format the output nicely
Without further ado, here is the search:
| pivot uberAgent Process_ProcessDetail
   latest(_time) as LastRun
   values(AppVersion) as AppVersions
   splitrow
      AppName
| eval LastRun=strftime (strptime (LastRun, "%Y-%m-%dT%H:%M:%S.%Q%z"), "%Y-%m-%d %H:%M:%S")
| join type=outer AppName
[
   | pivot uberAgent Session_SessionDetail_Users
      count(SessionFgAppName) as CountSessionFgAppName
      splitrow
         SessionFgAppName
   | eventstats sum(CountSessionFgAppName) as EventCount
   | eval "Application in foreground (%)"= round(CountSessionFgAppName / EventCount * 100, 1)
   | rename SessionFgAppName as AppName
   | fields AppName "Application in foreground (%)"
]
| eval sortfield = lower('AppName')
| sort limit=0 sortfield
| rename
   AppName as "Application name"
   AppVersions as "Application version(s)"
   LastRun as "Application last run date"
| table
  "Application name"
  "Application version(s)"
  "Application last run date"
  "Application in foreground (%)"
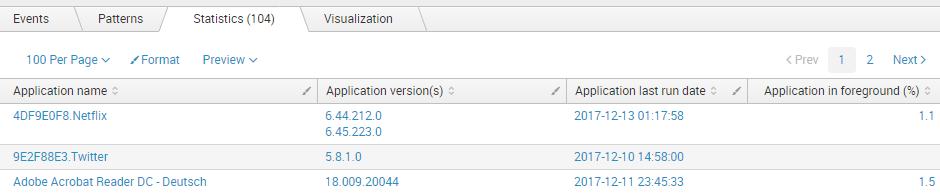
The Output
The resulting table can easily be exported in various formats or scheduled for regular automated report generation:
About uberAgent
The uberAgent product family offers innovative digital employee experience monitoring and endpoint security analytics for Windows and macOS.
uberAgent UXM highlights include detailed information about boot and logon duration, application unresponsiveness detection, network reliability drill-downs, process startup duration, application usage metering, browser performance, web app metrics, and Citrix insights. All these varied aspects of system performance and reliability are smartly brought together in the Experience Score dashboard.
uberAgent ESA excels with a sophisticated Threat Detection Engine, endpoint security & compliance rating, the uAQL query language, detection of risky activity, DNS query monitoring, hash calculation, registry monitoring, and Authenticode signature verification. uberAgent ESA comes with Sysmon and Sigma rule converters, a graphical rule editor, and uses a simple yet powerful query language instead of XML.
About vast limits
vast limits GmbH is the company behind uberAgent, the innovative digital employee experience monitoring and endpoint security analytics product. vast limits’ customer list includes organizations from industries like finance, healthcare, professional services, and education, ranging from medium-sized businesses to global enterprises. vast limits’ network of qualified solution partners ensures best-in-class service and support anywhere in the world.


