Experience Score
uberAgent’s experience score is a rating system that calculates and visualizes the current and past status of all applications, devices, and user sessions monitored by uberAgent.
Experience scores range from zero to ten. Scores from zero to four are considered bad, scores from four to seven are considered medium, and scores from seven to ten are considered good.
Experience Score Dashboard
The experience score dashboard is the entry point of the uberAgent UXM Splunk app. It visualizes experience scores for the entire estate, breaking the data down by category and component, highlighting components where potential issues originate from.
The dashboard also provides quick access to important KPIs like logon duration, application responsiveness, or application errors.
Overall Score

The filter at the top allows filtering the dashboard to a subset of machines. By default, all machines are shown.
On the left in the second row, one can see the overall score and the trend compared to yesterday. On the right, the score development over time is visualized.
Machine, User Session, and Application Scores

The overall score derives from three categories:
- Machine score: quality indicator for machine performance and health
- User session score: quality indicator for user session performance and health
- Application score: quality indicator for application performance and health
The charts show a trend indicator for the last day as well as a sparkline for the last seven days.
Score Components
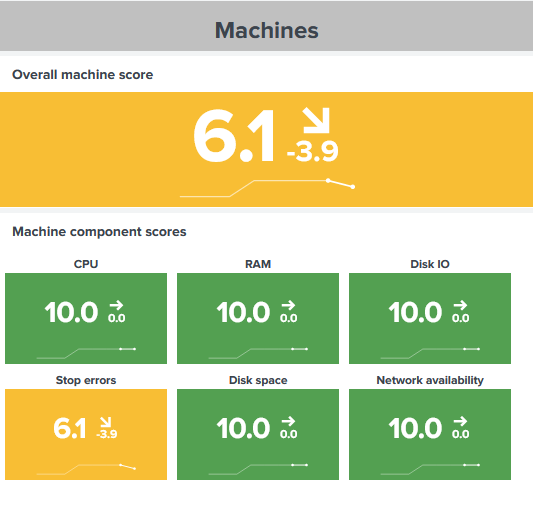
Each category is calculated by different components. Components differ per category. For example, Stop errors is a component solely for the machine category, while the Protocol latency component is only part of the user session category. There are also common components, like CPU or RAM.
The categories allow us to see issues in an environment, and the components unveil the cause (or causes). In the screenshot above, the low machine score is caused by a lot of stop errors (BSODs).
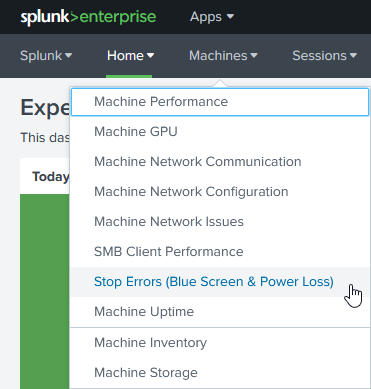
In that case, checking the Stop Errors (Blue Screen & Power Loss) dashboard in the Machine menu shows the problematic machines.
Analyzing Individual Machines, User Sessions, and Applications
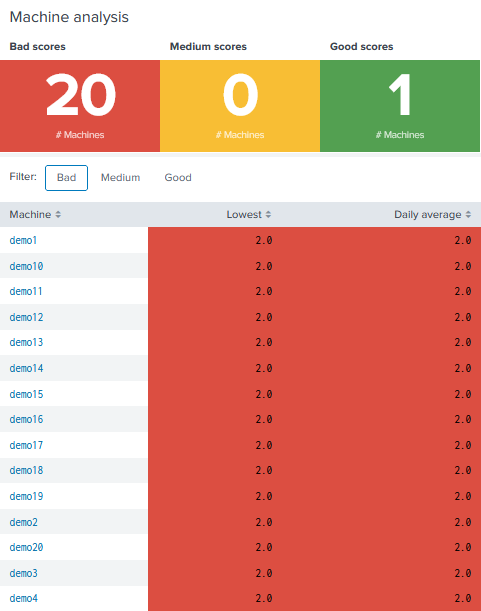
The charts below show scores for individual machines, user sessions, and applications for today. Items with bad (red) or medium (yellow) scores may need attention the most. Click on an item in the table to get a drilldown.

A new chart opens showing the components over time for that item. That allows us to see when the issue or the issues started. To analyze the item in detail, click on the analyze button, which redirects to a new page.
More Details

Scores might not be enough to get an overview. One may want to see real numbers, for example, login times, to get a better understanding of the performance.
Click on the plus sign next to the More details title to reveal charts with more details. Click an item of interest to get a drilldown.
Score Calculation
Component scores are evaluated at every full and half hour for the past 30 minutes. Calculations span a time interval of three minutes, resulting in 10 sections (30 minutes/3 minutes = 10). If a section is above a threshold, a threshold counter is incremented.
Each score has two thresholds. One for low severity, the other for high severity. Each threshold has a weight.
A score is calculated as follows: 10 - (Low severity threshold counter x low severity threshold weight + high severity threshold counter x high severity threshold weight)
- Example 1: Three sections above the low severity threshold as well as a weight of 0.5. The score would be:
10 - (3 x 0.5) = 8.5 - Example 2: Three sections above the low severity threshold (weight = 0.5) and two sections above the high severity threshold (weight = 1). The score would be:
10 - (3 x 0.5 + 2 x 1) = 6.5
Note: The higher the weight, the lower the score.
Below is a list of default thresholds and weights. To modify the defaults, see Modifying the Score Calculation.
Machine
| Threshold | Setting | Default value | Unit | Default weight |
|---|---|---|---|---|
| CPU usage. Low severity. | ThresholdMachineCPUPercentLowerBound | 80 | % | 0.5 |
| CPU usage. High severity. | ThresholdMachineCPUPercentHigherBound | 90 | % | 1 |
| RAM usage. Low severity. | ThresholdMachineRAMPercentLowerBound | 80 | % | 0.5 |
| RAM usage. High severity. | ThresholdMachineRAMPercentHigherBound | 90 | % | 1 |
| DIsk IO usage. Low severity. | ThresholdMachineIOPercentLowerBound | 80 | % | 0.5 |
| Disk IO usage. High severity. | ThresholdMachineIOPercentHigherBound | 90 | % | 1 |
| Stop errors. Low severity. | ThresholdStopErrorCountLowerBound | 1 | Count | 0.7 |
| Stop errors. High severity. | ThresholdStopErrorCountHigherBound | 2 | Count | 1 |
| Disk usage. Low severity. | ThresholdMachineDiskUsagePercentLowerBound | 80 | % | 0.2 |
| Disk usage. High severity. | ThresholdMachineDiskUsagePercentHigherBound | 90 | % | 0.5 |
| Network availability. Low severity. Note: higher is better |
ThresholdMachineNetworkAvailabilityPercentLowerBound | 95 | % | 0.2 |
| Network availability. High severity. Note: higher is better |
ThresholdMachineNetworkAvailabilityPercentHigherBound | 90 | % | 0.5 |
User session
| Threshold | Setting | Default value | Unit | Default weight |
|---|---|---|---|---|
| CPU usage. Low severity. | ThresholdSessionCPUPercentLowerBound | 80 | % | 0.5 |
| CPU usage. High severity. | ThresholdSessionCPUPercentHigherBound | 90 | % | 1 |
| RAM usage. Low severity. | ThresholdSessionRAMPercentLowerBound | 80 | % | 0.5 |
| RAM usage. High severity. | ThresholdSessionRAMPercentHigherBound | 90 | % | 1 |
| Disk IO latency. Low severity. | ThresholdIOLatencyLowerBound | 20 | ms | 0.5 |
| Disk IO latency. High severity. | ThresholdIOLatencyHigherBound | 30 | ms | 0.7 |
| Logon duration. Low severity. | ThresholdLogonDurationLowerBound | 30 | s | 0.2 |
| Logon duration. High severity. | ThresholdLogonDurationHigherBound | 60 | s | 0.4 |
| Protocol latency. Low severity. | ThresholdSessionRpLatencyMsLowerBound | 100 | ms | 0.2 |
| Protocol latency. High severity. | ThresholdSessionRpLatencyMsHigherBound | 200 | ms | 0.5 |
Application
| Threshold | Setting | Default value | Unit | Default weight |
|---|---|---|---|---|
| CPU usage. Low severity. | ThresholdAppCPUPercentLowerBound | 80 | % | 0.5 |
| CPU usage. High severity. | ThresholdAppCPUPercentHigherBound | 90 | % | 1 |
| RAM usage. Low severity. | ThresholdAppRAMMBLowerBound | 1024 | MB | 0.1 |
| RAM usage. High severity. | ThresholdAppRAMMBHigherBound | 2048 | MB | 0.3 |
| Disk IO. Low severity. | ThresholdAppIOCountLowerBound | 200 | Count | 0.1 |
| Disk IO. High severity. | ThresholdAppIOCountHigherBound | 400 | Count | 0.3 |
| Network availability. Low severity. Note: higher is better |
ThresholdAppNetworkAvailabilityPercentLowerBound | 95 | % | 0.2 |
| Network availability. High severity. Note: higher is better |
ThresholdAppNetworkAvailabilityPercentHigherBound | 90 | % | 0.5 |
| Network latency. Low severity. | ThresholdAppSendLatencyMsLowerBound | 100 | ms | 0.2 |
| Network latency. High severity. | ThresholdAppSendLatencyMsHigherBound | 300 | ms | 0.5 |
| Application UI delay. Low severity. | ThresholdAppUIDelaySLowerBound | 5 | s | 0.2 |
| Application UI delay. High severity. | ThresholdAppUIDelaySHigherBound | 10 | s | 0.5 |
| Application errors. Low severity. | ThresholdApplicationErrorCountLowerBound | 1 | Count | 0.5 |
| Application errors. High severity. | ThresholdApplicationErrorCountHigherBound | 2 | Count | 1 |
Modifying the Score Calculation
The scores’ default calculation settings have been chosen in a careful selection and tuning process. They should work well in most environments. Please read on if you find that the calculations should be optimized for your organization’s requirements.
Before Modifying
Before making changes, note the following:
- The lowest weight possible is 0.
- The highest weight possible is 1.
- The sum of all weights doesn’t need to be 1. Each component is calculated separately.
- All components together form a total machine/user session/application score. The total score is always equal to the lowest component score.
Modifying
To modify the score calculation, change the following three input lookup files in $SPLUNK_HOME/etc/apps/uberAgent/lookups. See Score Calculation for calculations and settings.
- Machine:
score_machine_configuration.csv - User session:
score_session_configuration.csv - Application:
score_application_configuration.csv
After Modifiying
- Distribute the changed input lookup files to all search heads
- It is best to delete all previous scores as they cannot be compared to the new ones. See Deleting Scores for instructions.
New versions of uberAgent may introduce new scores or changes to calculations for existing scores. Hence your score modifications will be overridden when updating uberAgent.
Score Storage
Scores are stored in the Splunk index score_uberagent_uxm. The scores for the current date get aggregated at midnight (average per day) and then stored in the index as well.
If you want to delete the scores, see Deleting Scores.
Deleting Scores
Scores are stored in the Splunk index score_uberagent_uxm and can be deleted via the CLI.
splunk clean eventdata -index score_uberagent_uxmTroubleshooting
If the Experience Score dashboard stays empty, try the following troubleshooting steps.
- Scores are stored in an additional Splunk index
score_uberagent_uxmsince version 6.1. Check whether the index exists. - Scores are calculated through saved searches running on Splunk search heads. In a distributed Splunk environment, configure the search heads to forward data to the indexer layer.